
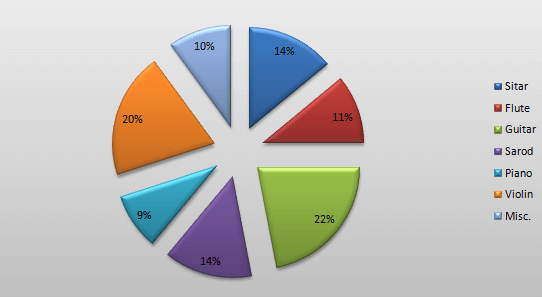
Directions: The following pie-chart shows the preference of musical instruments of 60000 people surveyed over whole India. Examine the chart and answer the questions.
Question 1:
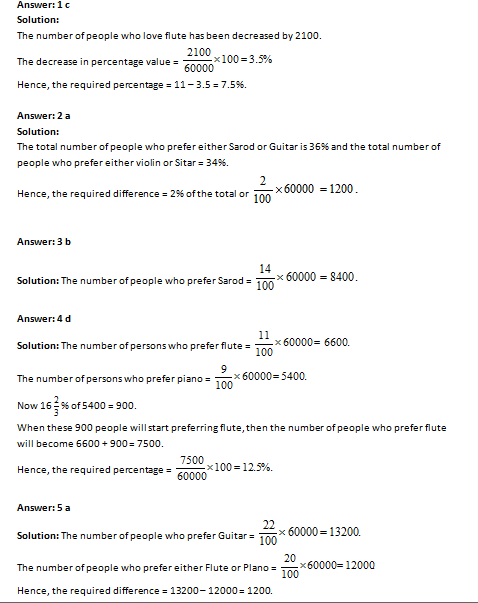
If the number of people who prefer Flute are decreased by 2100, then the percentage of people who prefer flute would have been:
(a) 9.5%
(b) 6.5%
(c) 7.5%
(d) 8.5%
Question 2: The total numbers of people who prefer either Sarod or Guitar, is greater than the total number of people who prefer either violin or Sitar by:
(a) 1200
(b) 1600
(c) 1100
(d) 1400
Question 3: The number of people who prefer the musical instrument Sarod is:
(a) 7400
(b) 8400
(c) 6400
(d) 8600
Question 4: If 16 % of the people prefer Piano, would go with the people who prefers Flute, the percentage of people who prefer Flute would have been
(a) 13.5%
(b) 14.5%
(c) 15.5%
(d) 12.5%
Question 5: The number of people who prefer Guitar is greater than the total number of people who prefer either Flute or Plano by:
(a) 1200
(b) 1100
(c) 1300
(d) 1400
Answers and Explanations


I think the answer for the first question is 14.5%?
I think, you need to observe the Qn first,
It is 11% and we are decreasing it by 2100 means 3.5%
which would equal to 7.5 %