
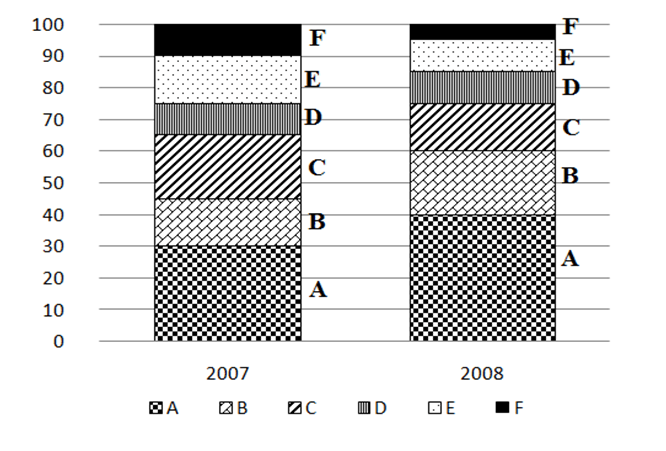
Direction: The bar- chart given below shows the percentage distribution of the production of various models of a mobile manufacturing company in 2007 and 2008. The total production in 2007 was 35 lakh mobile phones and in 2008 the production was 44 lakh. Study the chart and answer the following questions.
Question 1: Total number of mobiles of models A, B and E manufactured in 2007 was
(1) 24,50,000
(2) 22,75,000
(3) 21,00,000
(4) 19,25,000
Question 2: For which models was the percentage variation in production from 2007 to 2008 the maxi¬mum?
(1) B and C
(2) C and D
(3) D and E
(4) A and B
Question 3: What was the difference in the number of B type mobiles pro¬duced in 2007 and 2008 ?
(1) 3,55,000
(2) 2,70,000
(3) 2,25,000
(4) 1,75,000
Question 4: If the percentage production of A type mobiles in 2008 was same as that in 2007, then the number of A type mobiles produced in 2008 would have been
(1) 14,00,000
(2) 13,20,000
(3) 11,70,000
(4) 10,50,000
Question 5: If 85% of the D type mobiles produced in each year were sold by the company, how many D type mobiles remained unsold ?
(1) 76,500
(2) 93,500
(3) 1,18,500
(4) 1,22,500
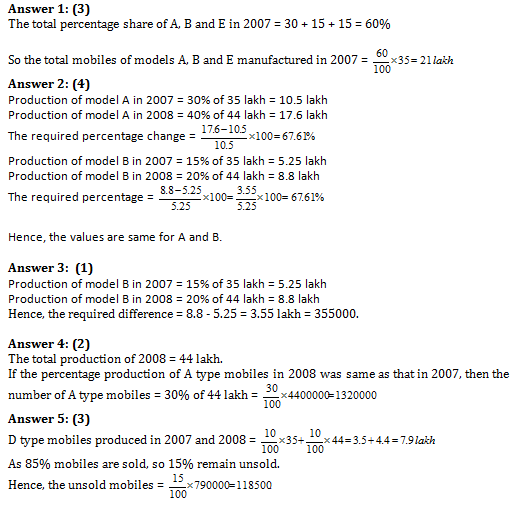
Answers and Explanations