

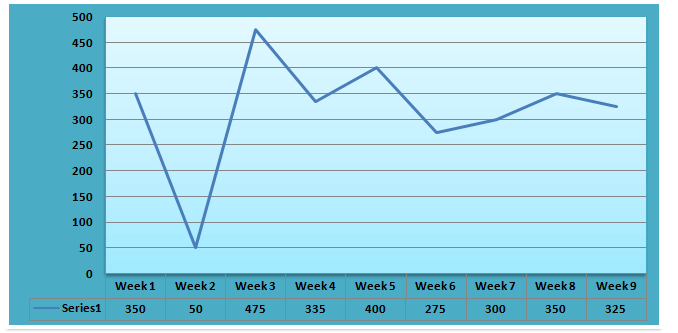
Direction for the question : Study the following graph which shows the demand forecast for the next ten weeks.
Question 1: If the forecasted demand is met by having uniform production during the weeks at an average level, then the number of weeks during which demand will not be met is:
(a) 2
(b) 3
(c) 6
(d) None of these
Question 2: If the maximum production capacity is 300 units, then the unmet demand in week 3 will be:
(a) 225
(b) 275
(c) 175
(d) All the demand will be met
Answers and Explanations
Answer 1: (c)
The average demand = (350+50+475+335+400+275+300+350+325)/9 =317 to 318 approximately. Any week for which demand is more than this number, the production will not able to meet the demand. There 6 such weeks. The correct option is (c).
Answer 2: (d)
The unmet demand will be 475-300=175. The correct option is (c).


