

Direction for the questions: Study the following graph and pie chart carefully to answer the questions given below:
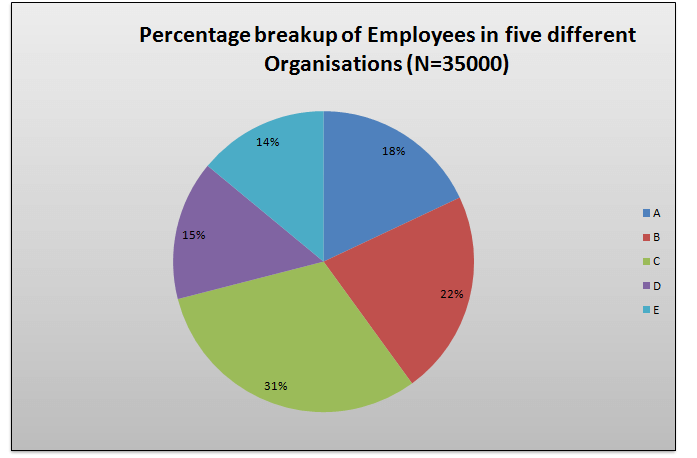
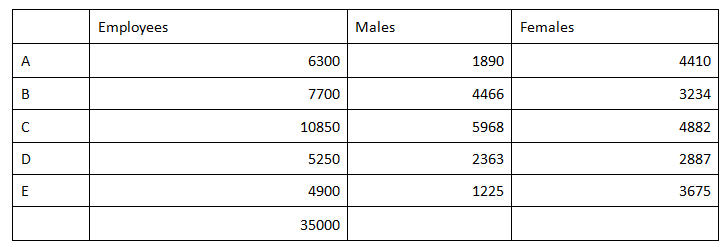
Question 1: Total number of employees in Organization C is approximately what per cent of total number of employees in Organization D?
(a) 147%
(b) 279%
(c) 312%
(d) 207%
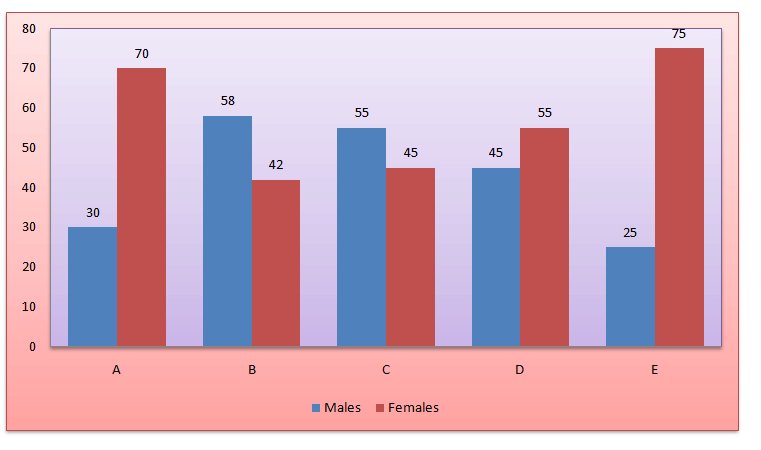
Question 2: What is the total number of males in all the Organizations together?
(a) 13350
(b) 14718
(c) 15912
(d) 16218
Question 3: What is the total number of males in Organizations A and C together?
(a) 6125
(b) 7858
(c) 8024
(d) 7406
Question 4: What is the difference between the number of females in Organization B and the number of females in Organization E?
(a) 441
(b) 357
(c) 174
(d) 312
Answers and Explanations
 Answer 1: (d)
The required percentage = (10850/5250)x100 = 207%
Correct option is (d)
Answer 2: (c)
Total number of males in all the Organizations together
= 1890 + 4466 + 5968 + 2363 + 1225 = 15912.
Correct option is (c).
Answer 3: (b)
The total number of males in A and C together is 1890 + 5968 = 7858.
Correct option is (b).
Answer 4: (a)
The difference between the number of females in Organization B and the number of females in Organization E =3675-3234 = 441.
Correct option is (a).


