
Direction for the question: Seven companies A, B, C, D, E, F, and G are engaged in production of companies two items I and II. The comparative data about production of these items by the seven companies is given in the following graph and table. Study the information carefully to answer these questions.
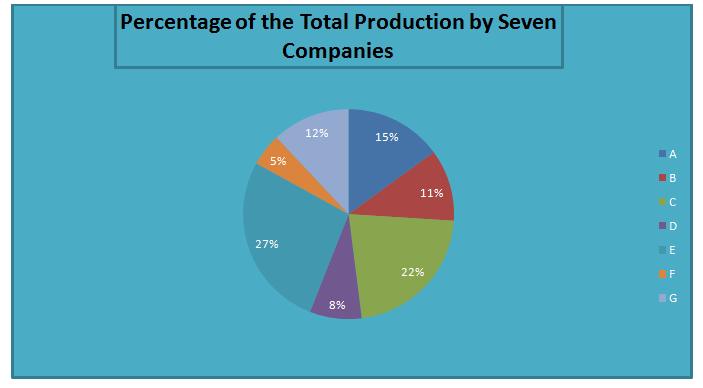
Cost of the total production (both items together) by seven companies = Rs.25 crores
The above pie chart represents the total production cost (Rs. 25 crores) for these companies combined.
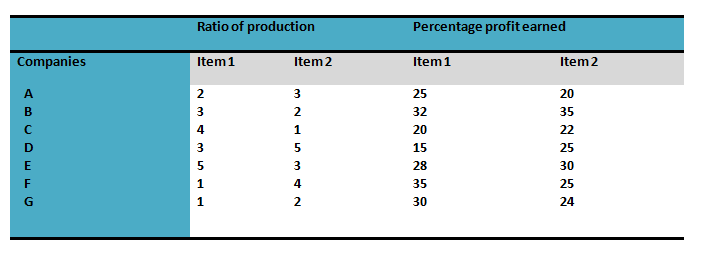
Ratio of production between items I and II and the per cent profit earned for the two Items. These are the only two items produced by these companies.
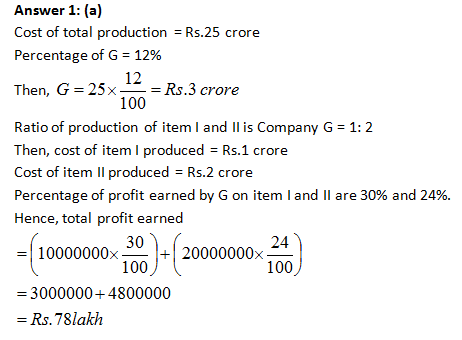
Question 1: What is the total profit earned by Company G for items I and II together?
(a) Rs.78 lakh
(b) Rs.1.62 crore
(c) Rs.16.2 lakh
(d) None of these
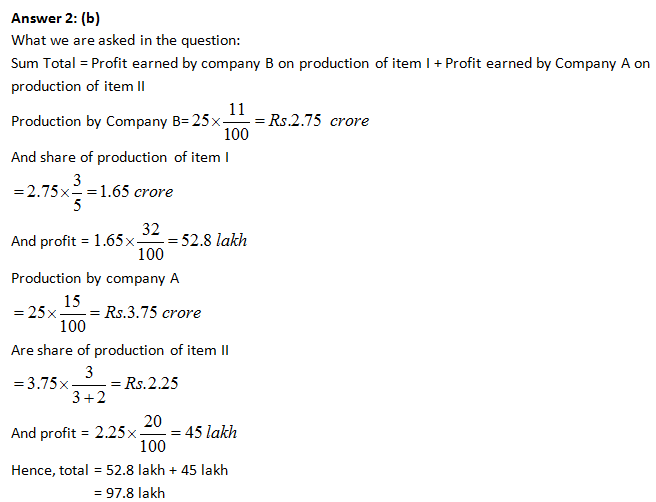
Question 2: What is the sum total of the profit earned by company B on production of item I and the profit earned by Company A on production of item II?
(a) Rs.9.78 crore
(b) Rs.97.8 lakh
(c) Rs.52.8 lakh
(d) Rs.30.65 lakh
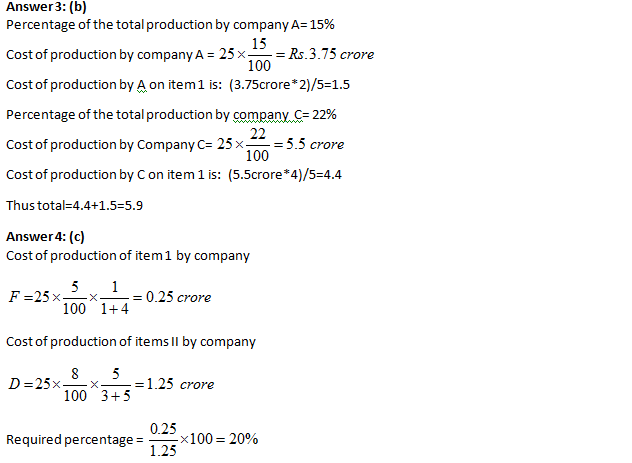
Question 3: What is the total cost of the production of item I by Companies A and C together in Rs.crore?
(a) 9.25
(b) 5.9
(c) 4.1625
(d) None of these
Question 4: Cost of production of item I by Companies F is what per cent of the cost of production of item II by company D?
(a) 16%
(b) 33.33%
(c) 20%
(d) 12.5%
Answers and Explanations