
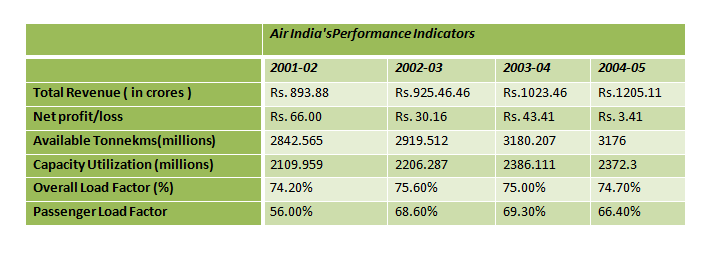
Directions (Q. Nos. 1-4): Study the following table and bar graph to answer these questions.
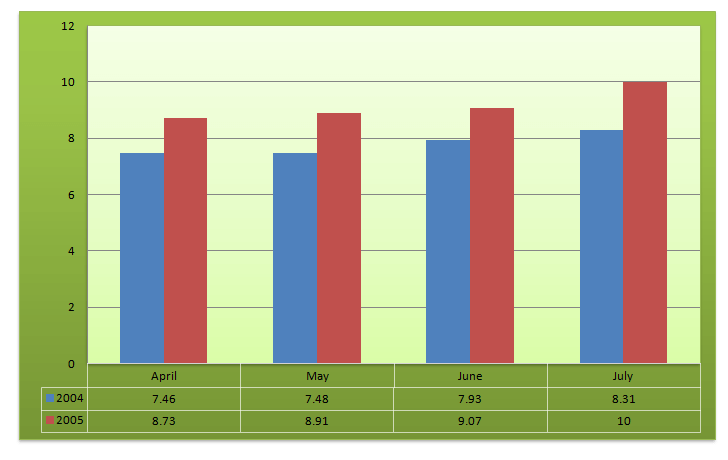
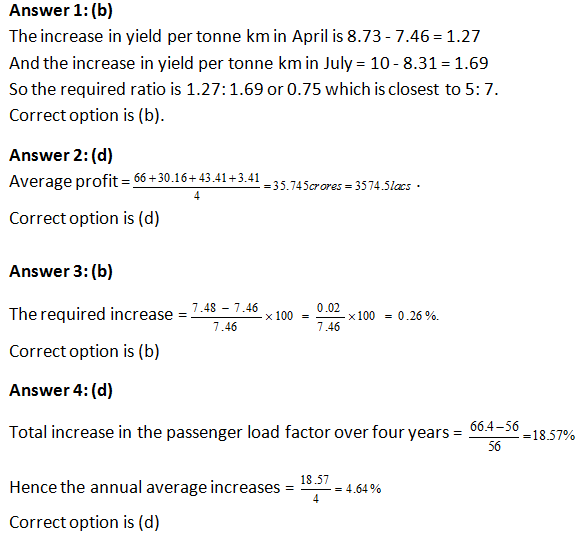
Question 1: Between 2004 and 2005, the increase in yield per tonne km in April as a ratio to the increase in yield per tonne km in July is closest to which of the following?
(a) 4 : 7
(b) 5 : 7
(c) 3 : 8
(d) 7 : 4
Question 2: Air India’s average profit from 2001-02 to 2004-05 was
(a) Rs.24015 lakh
(b) Rs.3576 lakh
(c) Rs.3404 lakh
(d) None of these
Question 3: Air India’s yield per tonne km from April to May 2004 increased by
(a) 0.29%
(b) 0.26%
(c) 0.36%
(d) 0.31%
Question 4: The annual average increase in the passenger load factor over the four years was
(a) 3.466%
(b) 2.6%
(c) 1.2%
(d) None of thes
Answers and Explanations