Directions: Study the following pie-charts carefully to answer these questions.
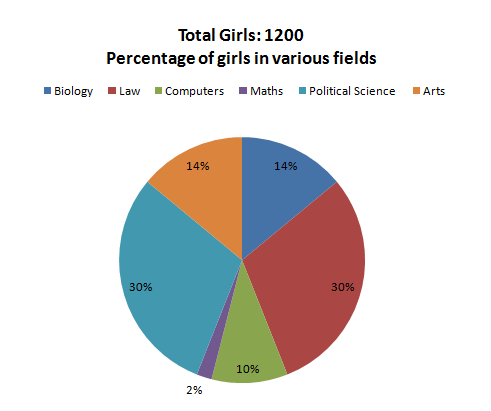
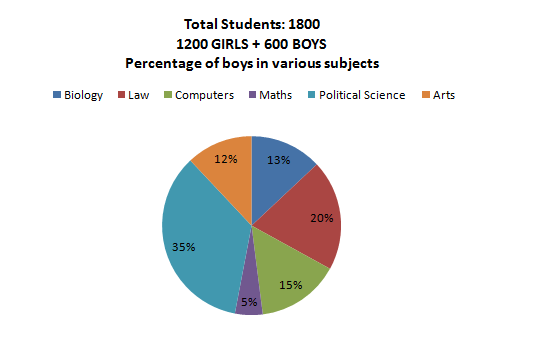
The graphs depict the following:
- Percentage of students in a college studying various subjects
- Percentage of girls out for various subjects.


Question 1: The number of girls studying Arts in college is
(a) 242
(b) 168
(c) 120
(d) 276
Question 2: For which subject is the number of boys the minimum?
(a) Law
(b) Biology
(c) Arts
(d) Maths
Question 3: For Political Science, what is the ratio of boys and girls?
(a) 4 : 3
(b) 3 : 4
(c) 2 : 3
(d) 4 : 5
Question 4: The number of girls studying Arts is what percent more than the number of boys studying Arts?
(a) 170%
(b) 150%
(c) 80%
(d) 250%
Answers and Explanations
Answer 1: (b)
The required number = 14% of 1200 = 168.
The correct option is (b)
Answer 2: (a)
In Law, the number of boys = 20% of 1800 – 30% of 1200 = 360 –360 = 0.
Thus, the number of boys in law is least.
The correct option is (a)
Answer 3: (b)
The required ratio is
= {(35% of 1800 – 30% of 1200)/(30% of the 1200)}
= ((630 -360)/360}
=27/36 = 3:4
The correct option is (b)
Answer 4: (d)
Number of girls studying arts = 14% of 1200 = 168
Number of boys studying arts = 12% of 1800 -168 = 216-168 = 48
The required percentage = {(168 – 48)/48} x 100 = 120/48 x 100 = 250%


