
Directions 1 to 4 : The table below represents the information collected by TRAI about the Service Area wise Access :f (Wireless + Wire line) subscribers in India. On the basis of the information provided in the table answer the questions nat follow.
Question 1. Which service area has observed maximum rate of change from Dec 2009 to March 2010 (in percentage)?
A. UP. (E)
B. Bihar
C. Orissa
D. Haryana
Question 2. As a result of a decision to allow only two or three telecom operators in a particular service area, TRAI allocates R-Com and Vodafone to operate only in the east of India and Idea and Airtel operate only in south. R-Com has got 28% subscribers in east while Vodafone has 72% subscribers; similarly Idea has 48% subscribers in the south while Airtel has 52% subscribers. How many subscribers do these four players have in 2010?
A. R-Com-28.03, Vodafone-73.22, ldea-86.22, Airtel-89.5
B. R-Com-30.03, Vodafone-72.82, ldea-85.02, Airtel-80.04
C. R-Com-28.03, Vodafone-76.24, ldea-84.01.Airtel-85.67
D. R-Com-30.03, Vodafone-77.22, ldea-82.99, Airtel-89.91
Question 3. Due to operability issues early in 2010 Madhya Pradesh and entire UP was added to the eastern telecom circle. The telecom operators in Madhya Pradesh and entire UP namely R-Com, Vodafone and Idea had 28%, 40% and 32% subscribers that each player has in the newly formed eastern circle in March 2010?
A. R-Com-30.01 %, Vodafone-55.72%, idea-14.27%
B. R-Com-32.01 %, Vodafone-53.72%, idea-14.27%
C. R-Com-28%, Vodafone-55.72%, idea-16.27%
D. None of these
Question 4. The all India rate of change in number of subscribers from December 2009 to March 2010 is?
A. 10.7%
B. 10.5%
C. 11.8%
D. 12.4%
Answers and Explanations
Answer 1. (C)
Rate of change for U.P (E)
![]()
Rate of change for Bihar
Rate of change for Orissa
Rate of change for Haryana
Hence, Orissa shows the maximum rate of change.
Answer 2. (D)
There is a slight ambiguity in the question regarding the distribution of states across the eastern and southern telecom circle. So avoid finding the exact figures in the region. A simple observation is that the subscribers of Idea and Airtel in south bears the ration 48 : 52 = 0.92 Going by options, only option (D) exactly matches this rate Note: Though not advisable in exams, the figures car be calculated exactly if we consider Bihar, West Bengal, Orissa Kolkata and Assam in the eastern circle and Tamil Nadu, Karnataka, Andhra Pradesh and Kerala in southern circle.
Answer 3. (C)
There is again ambiguity regarding the distribution of states in the eastern circle. Moreover, no instruction has been given to use the data from previous question, without which the question is not likely to be answerable.
Considering the data from the above question holds true, we get the following solution:
R –com subscribers in the eastern circle was 28% of the total subscribers whereas it is the same 28% in UP and Madhya Pradesh.
∴ R-com subscribers in new eastern circle = 28%.
There was no Idea subscriber in eastern region whereas 32% in UP and Madhya Pradesh
∴ Idea subscribers in new eastern region = 32% of (UP + Madhya Pradesh)
![]()
Total subscribers in new eastern circle = 30.03 + 77.22 +111.05 = 218.3 million
∴ Percentage of Idea subscribers
∴ Remaining subscribers in new eastern circle using Vodafone
= 100% – 28% – 16.27% = 55.73%.
Answer 4. (B)
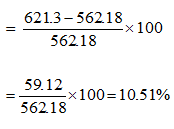
Number of subscribers in December 2009 = 562.18 million
Number of subscribers in March 2010 = 621.3 million
Percentage change