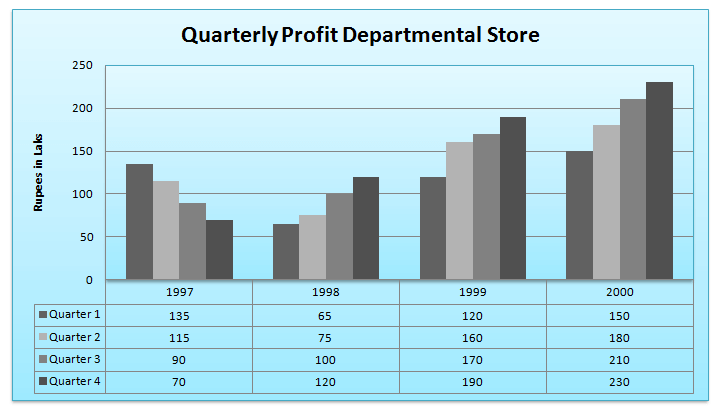
Direction for the question: Refer the given diagram to answer the questions:

Question 1: Approximately, what was the actual profit made by the department store in the second quarter of 1999?
(a) Rs. 160 lakh
(b) Rs. 170 lakh
(c) Rs. 180 lakh
(d) Rs. 210 lakh
Question 2: In which of the following quarters, did the departmental store make the least amount of profits?
(a) Third quarter of 2000
(b) Second quarter of 1999
(c) First quarter of 1999
(d) Third quarter of 1998
Question 3: During the period 1998-2000, how many quarters exceeded the profit of Rs. 150 lakh?
(a) 6
(b) 5
(c) 4
(d) 3
Question 4: In the year 2000, total profit made by the departmental store was approximately
(a) Rs. 540 lakh
(b) Rs. 630 lakh
(c) Rs. 720 lakh
(d) Rs. 770 lakh
Question 5: The total annual profit made by the departmental store increased by approximately what per cent from 1997 to 2000?
(a) 40%
(b) 50%
(c) 88%
(d) 120%
Answers and Explanations
Answer 2: (d) From the table it can be inferred that among the options 3rd quarter of 1998 is lowest.
Answer 3: (a) It can be easily counted from the table (refer to arrow marks.) Correct option is (a)
Answer 4: (d) The 4 quarters data are: 150lakh, 180lakh, 210lakh, 230lakh. Total profit = 150 + 180 + 210 + 230 = 770 lakh Correct option is (d)
Answer 5: (c) In 1997 the total was = 135+115+ 90+70 = 410lakh. In 2000 the total was = 150 + 180 + 210 + 230 = 770 lakh Percentage increase = $\frac{770-410}{410}\times 100=\frac{360}{410}\times 100=87.8%\approx 88%.$ Correct option is (c)


