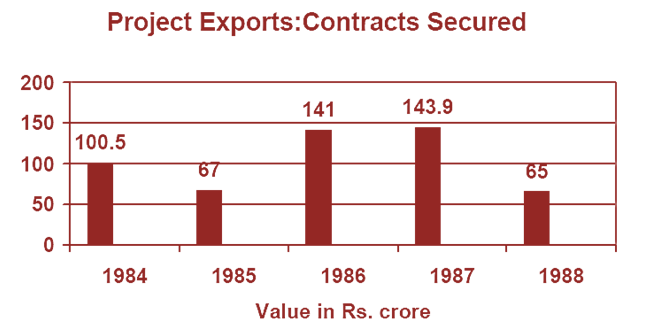
Direction for the question: Refer to the following Bar-chart and answer the questions that follow:

Question 1: What is the average value of the contract secured during the years shown in the diagram?
(a) Rs. 103.48 crore
(b) Rs. 105 crore
(c) Rs. 100 crore
(d) Rs.125.2 crore
Question 2: Compared to the performance in 1985 (i.e. taking it as the base), what can you say about the performances in the years ’84, ’85, ’86, ’87, ’88 respectively, in percentage terms?
(a) 150, 100, 211, 216, 97
(b) 100, 67, 141, 144, 65
(c) 150, 100, 200, 215, 100
(d) 120, 100, 220, 230, 68
Question 3: Which is the year in which the highest percentage decline is seen in the value of contract secured compared to the preceding year?
(a) 1985
(b) 1988
(c) 1984
(d) 1986
Answers and Explanations
Answer 1: (a)
This is a simple question. We simply need to find the average value in this case. This value can be calculated as follows:
(100.5 + 67 + 141 + 143.9 + 65)/5 = 103.48
Answer 2: (a)
The answer to this question needs to derived from the figure itself. You should not make any calculations in this question. We can see in the figure that the performance of year 1988 is the only one that is less than the year 1985. This means that this will be the only year that will a percentage less than 100 and all others will be greater than 100. Also, the difference between 1888 and 1985 is only 2 units and this means that there will not be huge difference in percentage for the two years. This helps us select option (a) as the correct answer.
Answer 3: (b)
As we can see from the figure above, the he highest percentage decrease over the previous year is in year 1988. The performance for 1988 is almost half of that of 1987. Thus, option (b) is the correct answer.


Doing great job to provide best…pprs