

DIRECTION : Study the graph below and answer the questions.
Total Assets are defined as Net Fixed Assets + Net Current Assets + Investments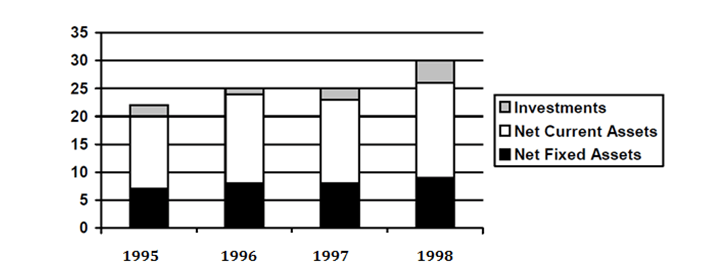
Question 1. In any two consecutive years, the growth rate is lowest for
(a) Net Fixed Assets.
(b) Net Current Assets.
(c) Investments.
(d) Total Assets.
Question 2. What is the approximate simple annual growth rate of Total Assets 1995 and 1998?
(a) 36%
(b) 12%
(c) 9%
(d) 27%
Question 3. The only item which has not shown a negative growth in every year between 1995 and 1998 is
(a) Net Fixed Assets.
(b) Net Current Assets.
(c) Investments.
(d) Total Assets.
Question 4. Between 1996 and 1997, the highest growth rate was seen for
(a) Net Fixed Assets
(b) Net Current Assets.
(c) Investments.
(d) Total Assets.
Answers and Explanations
Answer 1. (C)
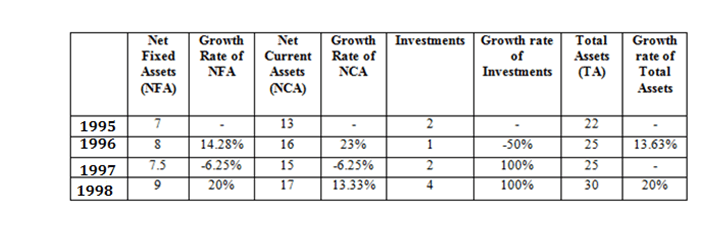
The growth rate is lowest for investments in 1995-96 i.e. 50% decrease.
Answer 2. (B)
From the table we can see that the growth rate between 1995-98 of total assets = (30-22)/22 = 36%. But this is over a 3 year period. Average annual growth rate = 36/3 = 12%.
Answer 3. (D)
Each and every particular thing is shown in negative growth, but the decrease in the total assets is not shown in this trend.
Answer 4. (C)
The highest growth rate was seen for investment in 1996 & 1997 i.e 100% increase.


