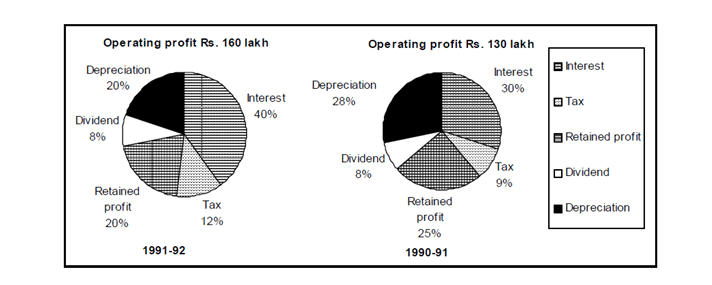
Direction for questions 1 to 5: Answer the questions based on the following pie charts.
Question 1: The operating profit in 1991-92 increased over that in 1990-91 by
a. 23%
b. 22%
c. 25%
d. 24%
Question 2: The interest burden in 1991-92 was higher than that in 1990-91 by
a. 50%
b. Rs. 25 lakh
c. 90%
d. Rs. 41 lakh
Question 3: If on an average, 5% rate of interest was charged on borrowed funds, then the total borrowed funds used by this company in the given two years amounted to
a. Rs. 221 lakh
b. Rs.1950 lakh
c. Rs. 568 lakh
d. Rs. 1030 lakh
Question 4: The retained profit in 1991-92, as compared to that in 1990-91 was
a. higher by 2.5%
b. higher by 1.5%
c. lower by 2.5%
d. lower by 1.5%
Question 5: The equity base of this company remained unchanged. Then the total dividend earning by the share holders in 1991-92 is
a. Rs. 124 lakh
b. Rs. 9 lakh
c. Rs. 10.4 lakh
d. Rs. 12.8 lakh
Answers and Explanations
Answer 1. (A)
Operating profit in 1990-91 = 130 lakh
Operating profit in 1991-92 = 160 lakh
Percentage increase = (160 – 130)/130 × 100 = 300/13 = 23%
Answer 2. (B)
By analyzing the pie chart we can calculate that Interest in 1990-91 = 30% of 130 lakh = Rs. 39 lakh
Interest in 1991-92 = 40% of 160 lakh= Rs. 64 lakh
Hence, Interest burden in 1991-92 is greater than interest burden in 1990-91 by (64 – 39)lakh = Rs. 25 lakh
Answer 3. (D)
Total interest = sum of interest in 1990-91 and 1991-92 = (30% of 130) + (40% of 160) = (39 + 64)
= Rs. 103 lakh.
Now average rate of interest is 5% p.a. hence for two years the interest would be 5*2=10%
If borrowed fund is charged byinterest, then (10% of borrowed funds) = 103.
Hence, borrowed funds
= (10 × 103) = Rs. 1030 lakh.
Answer 4. (D)
From the given data in the pie chart
Retained profit in 1990-91 = (25% of 130) lakh= Rs. 32.5 lakh
Retained profit in 1991-92 = (20% of 160) lakh= Rs. 32 lakh
∴ Percentage change in retained profit = (32.5 – 32)/ 32.5 = 1.5% lower
Answer 5. (C)
Total dividend in 1990-91
= (8% of 130) = Rs. 10.4 lakh.


