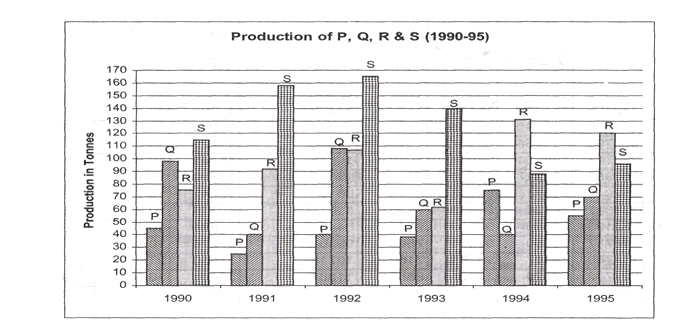
Direction for questions 1 -5: Answer the questions based on the following graph.
Question 1. In which year the annual growth rate of total production (of all products) is highest?
A. 1991
B. 1992
C. 1993
D. 1995
Question 2. If the stability of the production during 1990 to 1995 is defined as,

A. Product P
B. Product Q
C. Product R
D. Product S
For questions 3 to 5:

Question 3. If four products P, Q, R and S shown in the graph are sold at price of Rs.9, Rs.4, Rs.13 and Rs.3 respectively during 1990-1995, then the total revenue of the all the products is lowest in which year?
A. 1991
B. 1992
C. 1993
D. None of the above
Question 4. Individual revenue of P, Q, R and S for the entire period (1990-1995) is calculated based on the price of Rs.9, Rs.4, Rs.13 and Rs.3 respectively. Which product fetches the lowest revenue?
A. Product P
B. Product Q
C. Product R
D. Product S
Question 5. Four products P, Q, R and S shown in the graph are sold at price of Rs.9, Rs.4, Rs.13 and Rs.3 respectively during 1990-1995. Which of the following statements is TRUE?
A. Product R fetches second highest revenue across products in 1991.
B. Sum of revenue of P, Q and S is more than the revenue of R in. 1994.
C. Cumulative revenue of P and Q is more than the revenue of S in 1993.
D. None of the above
Answers and Explanations
For questions 1 to 5:
Answer 1. (B)
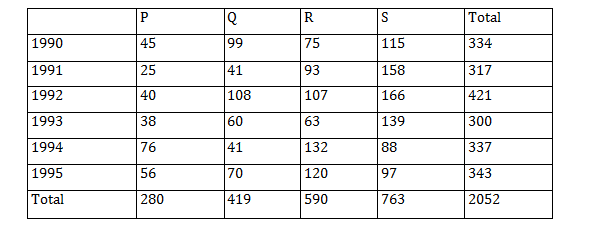
It can be easily concluded from the data given in the above table that the annual growth rate of total production is highest in 1992.
Answer 2. (D)
The stability of production during 1990 to 1995 for product P, Q, R and S is 0.92, 1.04, 1.43 and 1.63 respectively. Hence, product S is the most stable one.
Answer 3. (C)
The total revenue of all the products is lowest in the year 1993.
Answer 4. (B)
The product Q fetches the lowest revenue.
Answer 5. (C)
It can be concluded from the data calculated in the table given above that the statement given in option (C) is true.


