Directions : A train runs through cities A, B, C, D, E, F, G and H. The line graph indicates the time schedule of the train including times of arrival and departure.

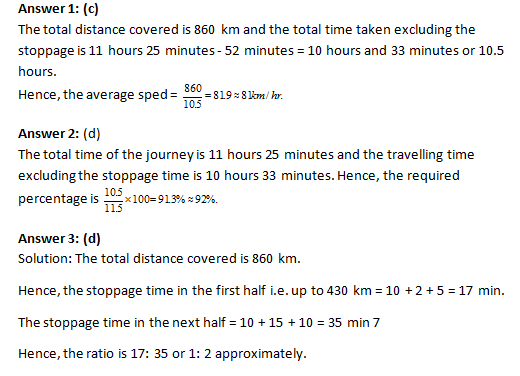
Question 1: The overall average speed of the entire trip excluding stoppage time is nearly
(a) 46 km/h
(b) 75 km/h
(c) 81 km/h
(d) 65 km/h
Question 2: What percentage of time of the entire trip was actually spent travelling between the cities?
(a) 76%
(b) 42.4%
(c) 7.6%
(d) 92%
Question 3: The total stoppage time at the cities in the first half and second half of the total distance is in the ratio
(a) 2 : 1
(b) 1 : 3
(c) 3 : 1
(d) 1 : 2
Question 4: Between how many pairs of consecutive stations does the train run below the overall average speed of the entire trip?
(a) 3
(b) 2
(c) 1
(d) 4
Answers and Explanations


how do we calculate stoppage time
?
from point B i.e. first arrival (a) to next departure(d) is the stoppage time for every station.
the line parallel to x-axis
B(a) 8:40 hrs to next d i.e. 8:50 hrs the stoppage is 10 min
next stoppage time will be 10:10 to 10:12 i.e. 2 minutes
and similarly for other cities.
how do we calculate stoppage time?
How did we calculate stoppage time?
in the last question, why is the waiting time not included while calculating average speed between two stations, as average speed is given by the formula TOTAL DISTANCE/TOTAL TIME which includes the general halt time while calculating avg speed in basic time speed distance questions? Please answer. 🙂
you start the time observation when the train starts, not when it is waiting on a platform. It’s assumed that way, as it’s common sense.
Hi @Wordpandit:disqus ,
Thanks for these sets of DI. Truly appreciate it 🙂
I have one problem. The fear of loosing time stops me from attempting calculative based options. For example the fourth qn in this set.
How do u suggest I tackle it?
give complete solution of this section
Hi Riken
Solutions are provided. In case any specific question is not clear, please post the question number.
Some images are missing in the Solutions section.
Hey Himanshu, that is a bug. We have identified it and are fixing it. Images will be up soon.
only ten sets are available earlier there were more .plz give us more sets of DI
Hey Rohan, we are re-doing most sections on Wordpandit. We are introducing everything level-wise (for better prep). We have already put up 25 odd sets and soon, all the sets will be back. In fact, you will see a greater number of sets now..:)
Can someone tell me how to calculate the stoppage time…. I’m missing something,,, so I’m not getting my answers right.
HELLO
AS IN THIS QUESTION CHART IS NOT CLEARLY DEFINED PLZ SEE IT …
Hi Abhinav, sufficient data is provided to solve the problem. Refer to the solutions in case of a doubt..:)
ITS ANUBHAV BRO …. I AM ASKING ABOUT THEGRAPH TIME IS NOT CLEARLY EXACTLY BELOW THE MARKS …ELSE QUESTION IS PERFECT AND SUFFICIENT DATA IS PROVIDED I AGREEE
Ah, Anubhav. We can work on a better graphic for sure..:)