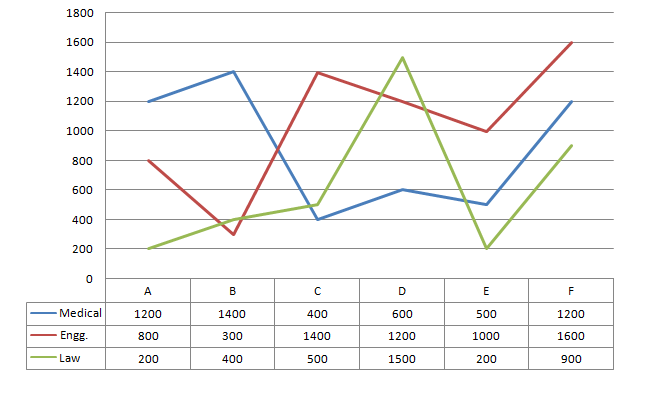
Directions : The following graph shows the number of successful candidates from different schools (A to F) in different disciplines. Study the graph carefully to answer these questions.

Question 1: In which of the following institutes is the difference between the number of successful candidates in Engineering and that in Medical discipline the maximum?
(a) F
(b) C
(c) B
(d) D
Question 2: The total number of successful candidates from Medical discipline is approximately what per cent
more than that from Law?
(a) 8%
(b) 15%
(c) 12%
(d) 43%
Question 3: The number of successful candidates from F in Engineering discipline is what per cent more than the
number of successful candidates from A in Medical discipline?
(a) 30%
(b) 33.33%
(c) 25%
(d) 20%
Question 4:
In which of the following institutes is the sum of the number of successful candidates in Engineering and Law disciplines is 50% of the number of Medical students of the same institute?
(a) C
(b) E
(c) D
(d) B
Answers and Explanations


HOW TO SOLVE QUESTION 2 ?? HELP ME OUT
I Think its a direct question they asked
“what % more than that of”
so just add them up separately for medical , law and find the (diff/law)*100
1 c,
2 d ,3 b, 4 d
Yes Ankita, you are right..:)
No Ankita, you are wrong. the correct answer is school A which isn’t mentioned in any of the given options. Hence none of these.
okk..ty