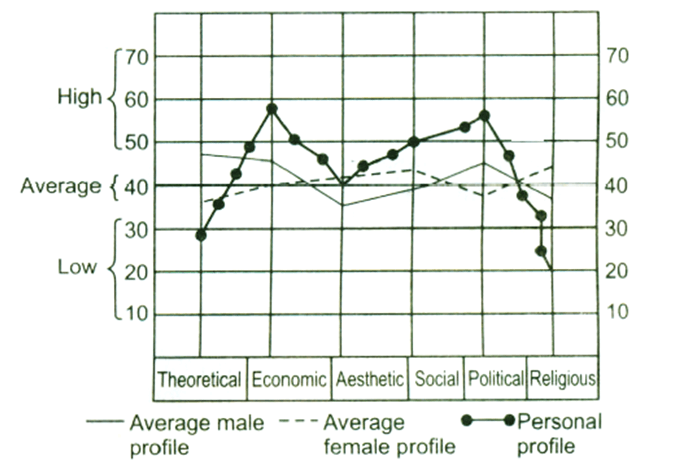
Direction for the questions :Use the graph given below to answer these questions. Given graph is the profile of values of a college student marked as personal profile. The normative profiles are given as average male profile and average female profile.

Question 1: Compare the three and state which of the given values is the highest in the personal profile of the student?
(a) Theoretical
(b) Religious
(c) Social
(d) Economic
Question 2: In the given personal profile, which is the value with the lowest score?
(a) Theoretical
(b) Religious
(c) Social
(d) Aesthetic
Question 3: In which value score, there exists maximum difference between average female profiles and personal profile?
(a) Theoretical
(b) Religious
(c) Economic
(d) Political
Question 4: In which value score, there exists convergence between personal profile and average female profile?
(a) Theoretical
(b) Social
(c) Aesthetic
(d) Both (a) and (c)
Question 5: In which value score, there exists a no difference state between the personal profile and average male profile?
(a) Economic
(b) Social
(c) Aesthetic
(d) None of these
Answers and Explanations
Answer: 2 (b) Clearly the graph for Personal profile has lowest values in the religious zone. Correct option is (b)
Answer 3: (b) The graph clearly shows that the gap between average female profiles and personal profiles is maximum in Religious zone. Correct option is (b)
Answer 4: (d) From the graph it can be clearly seen that the personal profile and average female profile almost meet in the Aesthetic zone and the Theoretical zone. So (d) is correct option.
Answer 5: (d) a, b and c are not true. Theoretical and political are the two states. Correct option is (d)


