


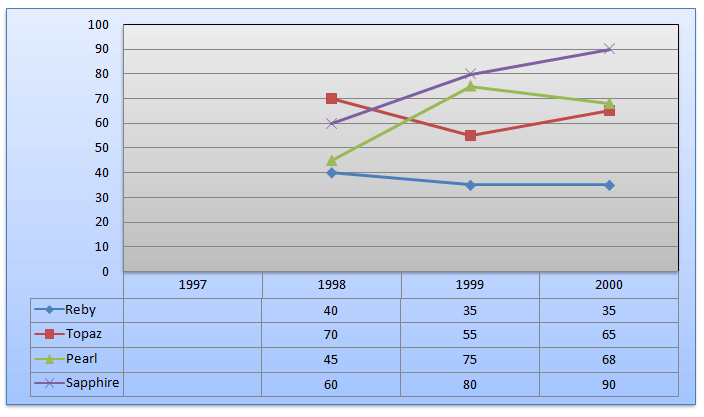
Directions (Q. Nos. 1-4): The scatter diagram shows the number of students passing in the high school’ examination in the given years from the four houses of a public School.

Question 1: The average number of students for each house who have passed in the given years nearest to
(a) 59
(b) 52
(c) 63
(d) 56
Question 2: The performance for which of the following houses is the best?
(a) Pearl
(b) Ruby
(c) Topaz
(d) Sapphire
Question 3: For which of the following houses is the percentage change in the results maximum for any year over the previous year?
(a) Topaz
(b) Pearl
(c) Sapphire
(d) Ruby
Question 4: The number of students keeps on increasing by 50 every years. In 1998, there were 250 students. For which of the following years is the performance best in the school?
(a) 1998
(b) 2000
(c) 1999
(d) Cannot be determined
Answers and Explanations
From above diagram we can make the following table :


Answer 1: (a) The total number of students = 718 in all years. Average = 718/12 = 59.8 (approx) Therefore, closest option is (a)
Answer 2: (d) By the total we can see Sapphire has more students passed in 3 years as compared to others. Correct option is (d)
Answer 3: (b) In Pearl house, students passing the exam in 1999 is 75 whereas in 1998 is 45. Hence the percentage change = $\frac{75-45}{45}\times 100=\frac{30}{45}\times 100=66.6%$ which is highest. Correct option (b)
Answer 4: (a)


Want to explore more Data Interpretation Sets?
- Data Interpretation (Level-2): Set-7
- Data Interpretation (Level-2): Set-8
- Data Interpretation (Level-2): Set-9
- Data Interpretation (Level-2): Set-10
- Data Interpretation (Level-2): Set-11
Explore Our Data Interpretation Sets
