


Directions for the questions: The graph below shows the end of the month market values of 4 shares for the period from January to June. Answer the following questions based on this graph.


Question 1: Which share showed the greatest percentage increase in market value in any month during the entire period?
(a) A
(b) B
(c) C
(d) D
Question 2: In which month was the greatest absolute change in market value for any share recorded?
(a) March
(b) April
(c) May
(d) June
Question 3: In which month was the greatest percentage increase in market value for any share recorded?
(a) February
(b) March
(c) April
(d) May
Question 4: An individual wishes to sell 1 share of C and 1 share of D to buy 1 share of A at the end of a month. At which month-end would the individual’s loss from this decision, due to share value changes, be the most?
(a) February
(b) March
(c) April
(d) June
Question 5: An individual decides to sell 1 share of C and 1 share of D to buy 1 share of A at the end of the month. What can be the individual’s greatest gain from this decision, due to share value changes?
(a) 5
(b) 10
(c) 15
(d) none
Answers and Explanations
Answer 1: (d)
The graph can be converted into the following table:
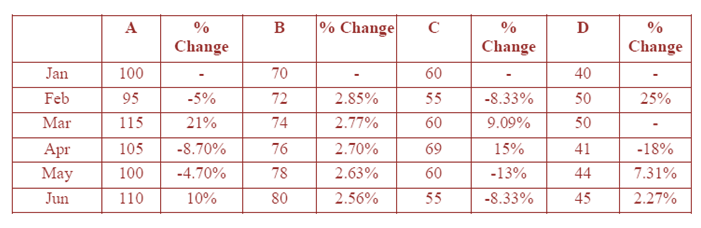

As it is seen the highest percentage increase is for D in February, that is 25%.
Answer 2: (a) The greatest absolute change in the market value for any share recorded is 20 i.e. for share ‘A” for month of March = 115 – 95 = 20
Answer 3. (a) The greatest percentage change in any share was recorded for share D for the month of February viz. 25%
Answer 4. (d) We can tabulate the values in the following table:
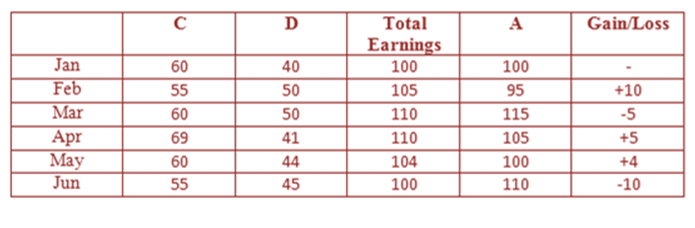

The final gain/loss is highlighted in the last column. We can see that the maximum loss due to share value changes is 10 for the month of Jun. Hence, the answer is (d).
Answer 5. (b)
We refer to the same table above in question 4.
It can be seen from above that the highest gain for individual is Rs.10.
Want to explore more Data Interpretation Sets?
- Data Interpretation (Level-3): Set-6
- Data Interpretation (Level-3): Set-7
- Data Interpretation (Level-3): Set-8
- Data Interpretation (Level-3): Set-9
- Data Interpretation (Level-3): Set-10
Explore Our Data Interpretation Sets
