
DIRECTION : Study the graph below and answer the questions that follow.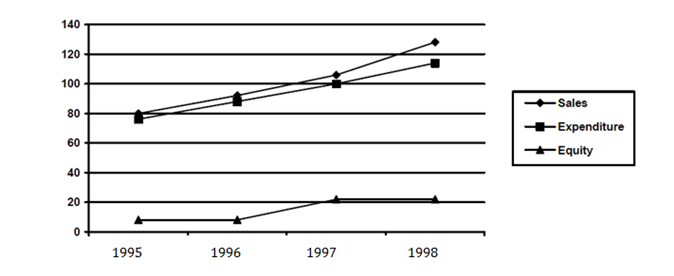
Question 1. The simple annual growth rate in sales was the highest between the years?
(a) 1995 – 96
(b) 1996 – 97
(c) 1997 – 98
(d) 1998 – 99
Question 2. In which year is the profit per rupee of equity the highest?
(a) 1999
(b) 1997
(c) 1998
(d) 1995 and 1996
Question 3. In which year is a sale per rupee of equity the highest?
(a) 1995
(b) 1996
(c) 1997
(d) 1998
Question 4. In which year are the sales per rupee of expenditure the lowest?
(a) 1995
(b) 1996
(c) 1997
(d) 1998
Answers and Explanations
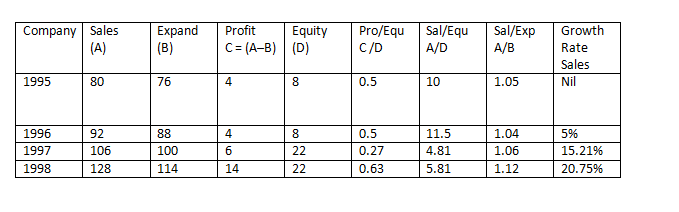
Answer 1. (c)
The simple annual growth rate in sales is maximum for the year 1997-98 i.e. 20.75%
Answer 2. (c)
It is clear that the profit per rupee of equity is highest for 1998 i.e. 0.63
Answer 3. (B)
Sales per rupee of equity is highest for 1996 i.e. 11.5
Answer 4. (B)
Sales per rupee of the expenditure are lowest for the year 1996 i.e. 1.04.
Want to explore more Data Interpretation Sets?
- Data Interpretation (Level-3): Set-9
- Data Interpretation (Level-3): Set-10
- Data Interpretation (Level-3): Set-11
- Data Interpretation (Level-3): Set-12
- Data Interpretation (Level-3): Set-13
Explore Our Data Interpretation Sets