Data interpretation test: Data interpretation test that you should take to excel in the DI section of the exams
Data interpretation test will help you tap your progress in preparation of Data Interpretation. By only going through theory and referring solved examples, it would be difficult for oneself to presume complete clarity in the topic and hence subject. A Test is the best indicator of subject understanding. Therefore, these practice sets provided here will help you test your understanding in individual concepts and help you prepare for a sectional data interpretation test that covers all the concepts in the subject. Therefore, practice these sets to ensure special attention to each concept and use it as a tool to prepare for the complete sectional data interpretation test.
Directions (1-5): Read the following pie-chart for the year 1998 and answer the questions given below it.
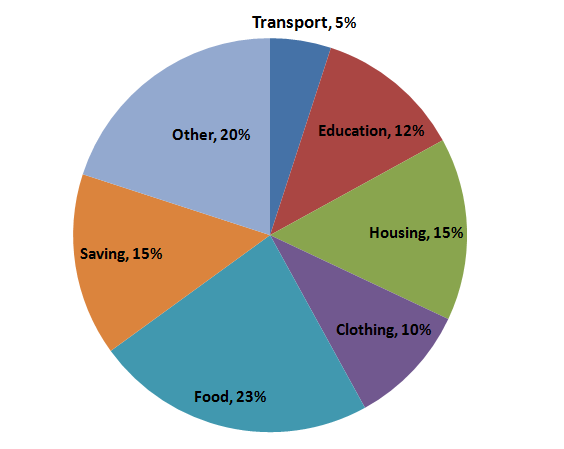
Please note: savings is not a part of expenditure.
Question 1: If the total amount spent during the year 1998 was Rs.46000, the amount spent on food was:
(a) Rs.2000
(b) Rs.12447
(c) Rs.23000
(d) Rs.2300
Question 2: If the total amount spent was Rs.46000, how much was spent on clothing and housing together?
(a) Rs.11500
(b) Rs.11050
(c) Rs.13529
(d) Rs.15000
Question 3: The ratio of the total amount of money spent on housing to that spent on education was:
(a) 5: 2
(b) 2: 5
(c) 4: 5
(d) 5: 4
Question 4: The given pie-chart shows that the maximum amount was spent on:
(a) Food
(b) Housing
(c) Clothing
(d) Others
Question 5: If the total expenditure of the family for the year 1998 was Rs.46000, the amount the family saved during the year is:
(a) Rs.1500
(b) Rs.15000
(c) Rs.6900
(d) Rs.8117
Answers and Explanations
Answer 1: b
The total amount spent = Rs 46000
This is 85% of the above pie chart.
The value in the pie-chart= Rs 46000/.85 = Rs. 54118
The amount spent on food was =23% of 54118= (23/100)x46000 = Rs. 12447
Answer 2: c
The total amount spent = Rs 46000
This is 85% of the above pie chart.
The value in the pie-chart= Rs 46000/.85 = Rs. 54118
Total share of clothing and housing = 10% + 15% = 25%
The total amount spent on clothing and housing = 25% of 54118 = (25/100) x 46000= Rs. 13529
Hence, the correct option is (c).
Answer 3: d
The data is given as a pie chart. So to calculate the ratio of the amount spent, we do not need the actual amount spent as it will be cancelled out in the final calculations.
The amount spent on housing is 15% and on education is 12% of the total.
Hence, the required ratio is 15: 12 = 5: 4. The correct option is (d).
Answer 4: a The sector which has the maximum percentage share in the pie chart showcases maximum amount spent. According to the graph, the maximum amount was spent on food which was 23% of the total gives (that is expenditure and saving). Since the individual expenditure is being calculated of the value given in the pie-chart, the individual expenses will be in the same ratio as that given in the pie-chart. The correct option is (a).
Answer 5: d
The total amount spent = Rs 46000
This is 85% of the above pie chart.
The value in the pie-chart= Rs 46000/.85 = Rs. 54118
Savings of the family = 15 % of 54118 = (15/100) x 46000 = Rs. 8117
The correct option is (d).
Want to explore more Data Interpretation Sets?
- Data Interpretation (Level-1): Set-2
- Data Interpretation (Level-1): Set-3
- Data Interpretation (Level-1): Set-4
- Data Interpretation (Level-1): Set-5
- Data Interpretation (Level-1): Set-6
Extra tips for data interpretation test:
• There may be additional information given in the sub questions, read well to understand if that is to be used only for that question or for all the questions ahead.
• Make use of values obtained in calculations in one question for other questions as well. This will save time wasted in re-calculation.
• Take multiple data interpretation tests to practice time management in the section.


I didnt get it.. spent 46000.. it means excluding saving… why saving is included in expenses?admin plz reply
if someones salary is 100 rs then 15% saving allows him to spend only 85 so the saving is excluded
I was also stuck on same thing
The given chart represents overall income not the expenditure
BADAC
why is saving treated as an expense in the answers?
for eg in case of food (23%) which is technically out of 85% because all other are expenses except savings. so wont we have to calculate out of 100% for each expenditure b cross multiplication? (for eg in case of food- 100 * 23/85)
I also think so, it should not have been the expense. instead 46k should have been the total income.
Good trick for Q3.
CAN SOM1 HELP ME,HOW TO SOLVE THIS.
THANKS
do you have answers for this
1. A 4. B
3 4 & 5 are interlinked need to answer 3
A,A,D,B,A
explain pls 🙂
set 1
1) b
2) a
3) d
4) a
5) c
Thank you for sharing. helped me matching the answers 🙂
bcdad