

Directions : The table given here shows production of five types of cars by a company in the year 1989 to 1994. Study the table and answer questions.
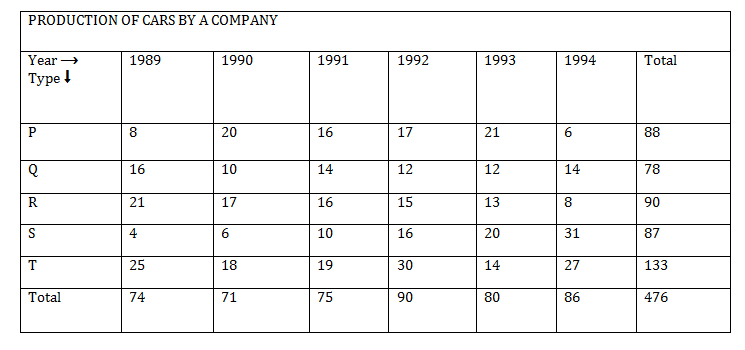
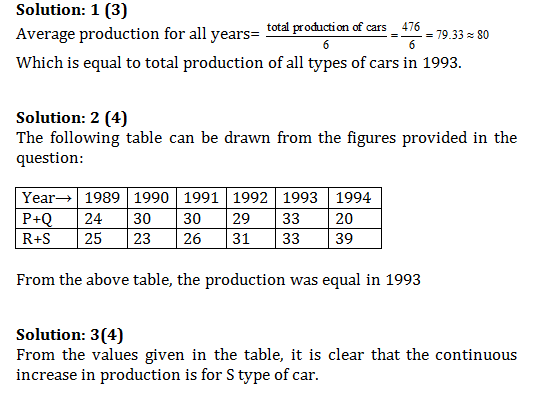
Question 1: In which year the production of cars of all types taken together was approximately equal to the average of the total production during the period?
(1) 1989
(2) 1991
(3) 1993
(4) 1994
Question 2: In which year the total production of cars of types P and Q together was equal to the total production of cars of types R and S together?
(1) 1990
(2) 1991
(3) 1994
(4) None of the above
Question 3: During the period 1989-94, in which type of cars was a continuous increase in production?
(1) P
(2) Q
(3) R
(4) S
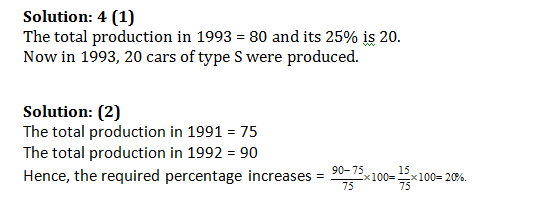
Question 4: The production of which type of cars was 25% of the total production of all types of cars during 1993?
(1) S
(2) R
(3) Q
(4) P
Question 5:The percent increase in total production of all types of cars in 1992 to that in 1991 was:
(1) 15
(2) 20
(3) 25
(4) 30
Answers and Explanations


Q1.” In which year the production of cars of all types taken together was approximately equal to the average of the total production all these years?” would be a better description of the problem in my opinion..Cheers!..Kudos to the great work team WordPundit is doing!…Thanks for such a selfless service you are providing..!