

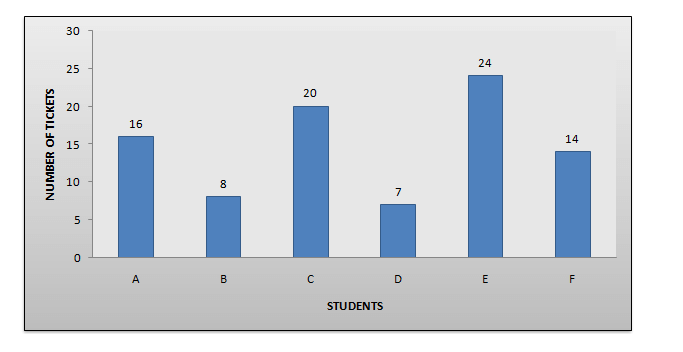
Directions: The bar graph, given here, shows the number of tickets sold by 6 students A, B. C, D, E and F during a fair. Observe the graph and answer questions based on it.
Question 1: Total number of tickets sold by A, B and C is
(1) 45
(2) 44
(3) 42
(4) 40
Question 2: The least number of tickets were sold by
(1) B
(2) F
(3) A
(4) D
Question 3: Total number of tickets sold by D, E and F is
(1) 47
(2) 46
(3) 45
(4) 44
Answers and Explanations
Answer 1: (2)
From the graph given in the question:
Ticked sold by A = 16
Ticked sold by B= 8
Ticked sold by C = 20
Hence, the total number of tickets sold by A, B and C = 16 + 8 + 20 = 44
Answer 2: (4) From the graph given in the question: Least number of tickets were sold by D. He sold 7 tickets.
Answer 3: (3) From the graph given in the question: Ticket sold by D = 7 Ticket sold by E = 24 Ticket sold by F = 14 Thus, the required answer is = 7 + 24 + 14 = 45.


please provide some good question …verbal is best but all others are not up
to level …DI and LR are worst..
i m regurly following ur mnthly 30 day plan pls pls add some high level Data interpretation
etna simple cat m nh ata
Hi Vandana, we are adding slowly and steadily more content. You will see tougher sets in August and September.