Direction: The bar graph given here shows the number of job-seekers of a state in various years at different stages of education.
Study the graph carefully and answer the questions based on it.
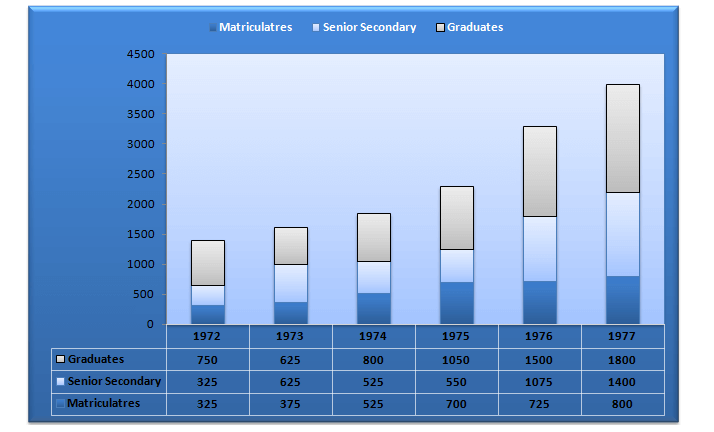
Question 1: In which year was the number of Graduate job-seekers the same as that of Senior Secondary job seekers ?
(1) 1973
(2) 1974
(3) 1975
(4) 1976
Question 2: In comparison to the year 1973. how many more job-seekers m. all. were there in the year 1977?
(1) 700
(2) 1700
(3) 2375
(4) 2150
Question 3: In which year, was the number of Matriculate job -seekers maximum?
(1) 1973
(2) 1975
(3) 1972
(4) 1977
Question 4: The number of job-seekers, having their qualification as Senior Secondary, in the year 1974 was :
(1) 525
(2) 800
(3) 1050
(4) 1875
Answers and Explanations
Answer 2: (3) Number of job seekers in 1977 = 1800 +1400 + 800 = 4000 Number of job seekers in 1973 = 625 + 625 + 375 = 1625 The required difference = 4000 – 1625 = 2375.
Answer 3: (4) The number of Matriculate job -seekers in 1977 is 800, which is the maximum.
Answer 4: (1) The number of job-seekers, having their qualification as Senior Secondary, in the year 1974 was 525.