


Directions: The pie-chart given below represents the number of students using different transport to a school in which total number of students is 2160.
Answer the questions based on the following diagram.
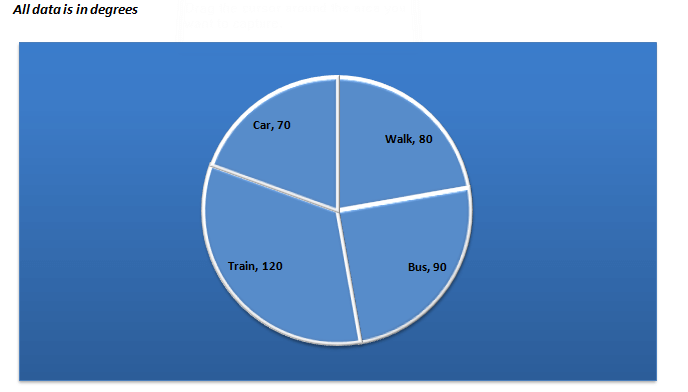

Question 1: The number of students who come to school by car is
(a) 70
(b) 290
(c) 420
(d) 480
Question 2: The ratio of the number of students who come to school by car to the number of students who come to school by bus is
(a) 21: 24
(b) 21: 27
(c) 36: 27
(d) 36: 21
Question 3: The total number of students coming to school either by walking or by bus is
(a) 480
(b) 540
(c) 1020
(d) 170
Question 4: The number of students who don’t come to School by train is
(a) 720
(b) 1020
(c) 2040
(d) 1440
Question 5: The number of students coming to school by bus exceeds the number of students coming to school walking by
(a) 10%
(b) 12.5%
(c) 11%
(d) 11.5%
Answers and Explanations


Want to explore more Data Interpretation Sets?
- Data Interpretation (Level-1): Set-40
- Data Interpretation (Level-1): Set-41
- Data Interpretation (Level-1): Set-42
- Data Interpretation (Level-1): Set-43
- Data Interpretation (Level-1): Set-44
Explore Our Data Interpretation Sets
