


These questions are based on the pie charts which represent the shift in water usage between 2006 and 2009; based on a survey conducted by Central Water Commission.
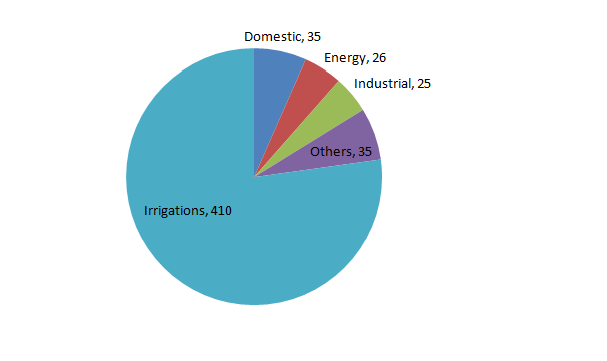
Water Usage in 2006 (In Trillion Litters )
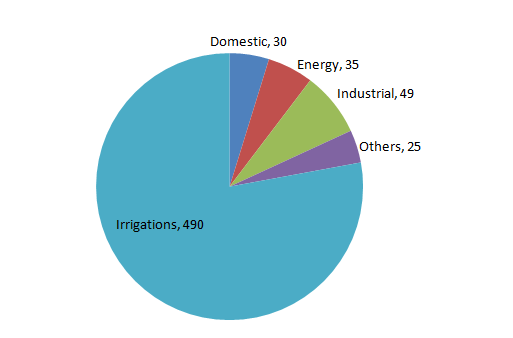
Water Usage in 2009 (In Trillion Litters )


Question 1: If the ratio of processing cost for water for industrial, energy and domestic usage is 3 : 5 : 2, what is the ratio of processing cost for above mentioned usage in 2006 to that in 2009?
(a) 0.68
(b) 0.72
(c) 0.60
(d) 0.77
Question 2: What is the percentage increase in usage in energy related sector from 2006 to 2009?
(a) 34.6%
(b) 23.3%
(c) 15.4%
(d) 17%
Question 3: What is the irrigation usage as percentage of total usage in 2009?
(a) 65.18%
(b) 83.45%
(c) 77.9%
(d) 69.6%
Question 4: What is the difference in domestic usage as percentage of total usage between 2006 and 2009?
(a) 3.16
(b) 2.08
(c) 2.26
(d) 1.91
Question 5: Which one out of the four shows the highest percentage increase in usage from 2006 to 2009?
(a) Domestic
(b) Industrial
(c) Others
(d) Energy
Answers and Explanations
Answer 1: (b)
Ratio of cost
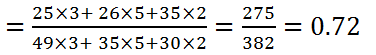

The correct option is (b)
Answer 2: (a)
Required percentage
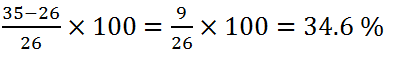

The correct option is (a)
Answer 3: (c)
Required percentage
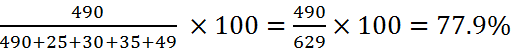

The correct option is (c)
Answer 4: (d)
Required difference
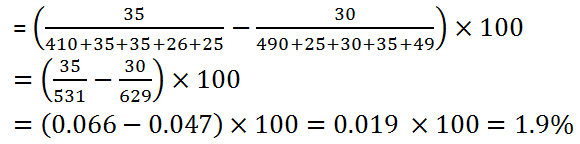

The correct option is (d)
Answer 5: (b)
We can see from the graph that for industrial sector, the usage is increased from 25 to 49 which is 96%. Hence, this is the maximum increase. For no other sector the usage became almost double.
Want to explore more Data Interpretation Sets?
- Data Interpretation (Level-2): Set-21
- Data Interpretation (Level-2): Set-22
- Data Interpretation (Level-2): Set-23
- Data Interpretation (Level-2): Set-24
- Data Interpretation (Level-2): Set-25
Explore Our Data Interpretation Sets
