
Study the tables below and answer the questions that follow each table:
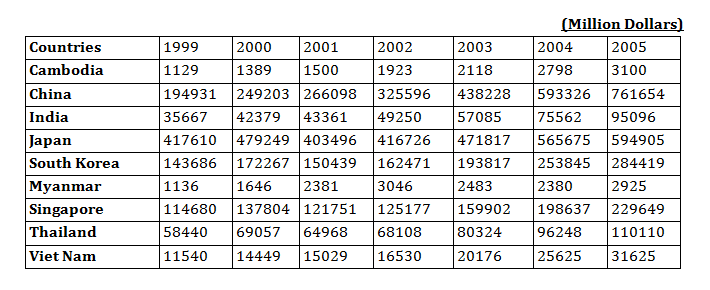
Table 1: World merchandise exports by Select Countries
Question 1. The third highest average annual export growth over the entire period (1999-2005) has been experienced by
A. Cambodia
B. India
C. Myanmar
D. Vietnam
Question 2. Which of the following statement is not true?
A. During 1999-2000, Myanmar registered the highest annual export growth rate.
B. India witnessed second highest annual export growth rate during 2003-2004.
C. Cambodia registered third highest annual export growth rate during 2001-2002.
D. The change in Thailand’s export growth rate from 2000-2001 to 2001-2002 was more than 10 percent.
Question 3. Which of the following statements is not false?
A. South Korea registered the third lowest export growth rate during the year 2000-2001.
B. The sum of the export growth rate of India and Vietnam during 2001-2002 is lower than the export growth rate of China during that particular year.
C. Myanmar witnessed maximum number of years of positive export growth rate during the entire period.
D. The difference between the export growth rate of China and Japan during 2004-2005 was lower than the export growth rate of Vietnam during that particular year.
Question 4. If we calculate the difference between the highest and the lowest average annual export growth rate experienced by the countries between 1999-2000 and 2004-2005, _____would get the second rank among all countries.
A. South Korea
B. India
C. China
D. Japan
Question 5. If we calculate the difference between the highest and the lowest average annual export growth rate experienced by the countries year-wise, the difference would be minimum during
A. 1999-2000
B. 2001 -2002
C. 2004-2005
D. 2003-2004
Answers and Explanations
Solution: For questions 1 to 5 :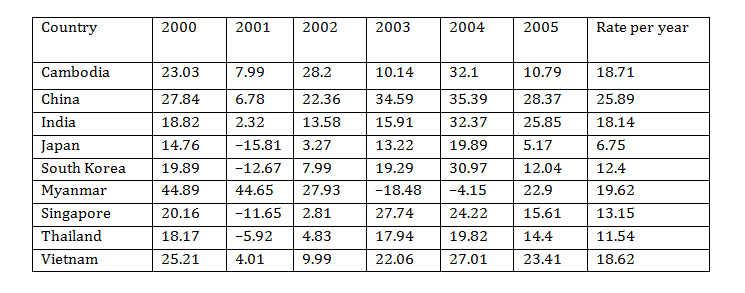
Answer 1. (A)
From the table given above, it is clear that Cambodia experienced the third highest average annual export growth rate over the period 1999 – 2005.
Answer 2. (C)
Option A: During 1999-2000, Myanmar registered the highest annual export growth rate, i.e., 44.89%. Hence, (A) is true.
Option B: During 2003-2004, India registered the second highest annual export growth rate, i.e., 32.37% after China. Hence, (B) is true.
Option C: During 2001-2002, Cambodia registered the highest annual export growth rate, i.e., 28.2%. Hence, (C) is not true.
Option D: The change in Thailand’s export growth rate from 2000-2001 to 2001-2002 is 4.83 – (- 5.92) = 10.75%. Hence, (D) is true.
Answer 3. (D)
Option A: During 2000 – 2001, South Korea registered thesecond lowest export growth rate just above Japan. Hence,(A) is false.
Option B: Sum of export growth rates of India and Vietnam during 2001 – 2002 = 13.58 + 9.99 = 23.57, which is not lower than the growth rate of China (i.e. 22.36%) in that particular period. Hence, (B) is false.
Option C: Cambodia, China, India and Vietnam witnessed maximum number of years of positive export growth rate during the entire period. Hence, (C) is false.
Option D: During 2004 – 2005, difference between the growth rates of China and Japan = 28.37 – 5.17 = 23.2%, which is lower than the export growth rate of Vietnam (23.41%) in the same period. Hence, (D) is not false.
Answer 4. (C)
*The language is slightly ambiguous. A likely solution is given below:
Difference between the highest and the lowest averageannual export growth rates by the countries for the periods1999-00 and 2004-05:
Cambodia 10.79 – 23.03 = –12.24%
China: 0.53%; India: 7.03%; Japan: –9.59%; South Korea: –7.85%; Myanmar: –21.99%; Singapore: -4.55%; Thailand: –3.77%; Vietnam: –1.8%
Clearly, China has the second highest difference.
Answer 5. (C)
*The language is slightly ambiguous. A likely solution is as below:
Difference between the highest and the lowest averageannual export growth rates by the countries yearwise forthe period:
1999 – 00: 44.89 – 14.76 = 30.13%
2001 – 02: 28.2 – 2.81 = 25.39%
2004 – 05: 28.37 – 5.17 = 23.2%
2003 – 04: 35.39 – (–4.15) = 39.54%
Hence, minimum is in the period 2004 – 05, i.e. option (C) is the correct answer.
Want to explore more Data Interpretation Sets?
- Data Interpretation (Level-2): Set-33
- Data Interpretation (Level-2): Set-34
- Data Interpretation (Level-2): Set-35
- Data Interpretation (Level-2): Set-36
- Data Interpretation (Level-2): Set-37
Explore Our Data Interpretation Sets