
Table : Industrial Emission Level of SO2 in Select City Points (1997-2003)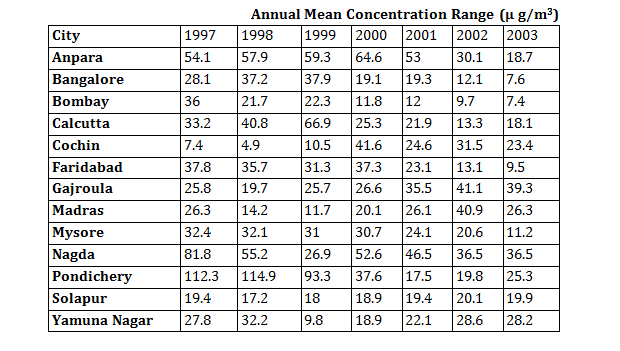
Question 1. Which of the following statement is false?
A. Average annual levels of SO2 emission for Pondichery over 1998-2003 is approximately 51.40 μg/m3.
B. Average annual levels is SO2 emission for Anpara over 1997-2003 is approximately 48.24 mg/μ3.
C. Average annual levels of SO2 emission for Madras over 1999-2003 is approximately 25.02 μg/m3.
D. Average annual levels of SO2 emission for Yamuna Nagar during 1997-2003 is approximately 23.47 μg/m3.
Question 2. If the highest average annual level of SO2 emission among the given cities is noted year-wise, then their difference would be maximum for the following pair of years:
A. 1998 and 2003
B. 1997 and 2001
C. 1997 and 2003
D. 1998 and 2002
Question 3. Which of the following statement is true?
A. Bangalore in 2003 registered the lowest level of SO2 emission in relation to the given data set.
B. The difference between the average annual level of SO2 emission during 1997-2003 for Pondichery and Gajroula is lower than the corresponding average annual level for Mysore.
C. The average annual level of SO2 emission during 1997-2000 for Faridabad is higher than the
average annual level for the city for the entire period (1997-2003).
D. The sum of the average annual level of SO2 emission during 1997-2003 for Bombay and Calcutta is lower than the corresponding average annual level for Anpara.
Question 4. If the SO2 emission level change for the given cities is noted year-wise, the difference would be maximum for which of the following option?
A. Cochin and Pondichery during 1999-2000.
B. Calcutta and Nagda during 1998-1999.
C. Madras and Anpara during 2001-2002.
D. Nagda and Pondichery during 1997-1998
Question 5. Which of the following statement is true?
A. While for Anpara, the SO2 annual emission level declined consistently during 2000-2001 and 2002-2003, the same increased consistently for Yamuna Nagar between 1998-1999 and 2001-2002.
B. During 2002-2003, the SQ2 annual emission level declined for maximum number of cities.
C. The absolute declined in annual SO2 emission level for Bombay during 1997-1998 was lower than the corresponding figure for Faridabad during 2000-2001.
D. The number of cities which experienced a decline in their annual SO2 emission level during 1999-2000 was more than the corresponding figure during 1998-1999. Which of the following statement is true?
Answers and Explanations
Answer 1. (D)
The average annual level of SO2 emission for Yamuna Nagar during 1997-2003 is 23.94 and not 23.74 μg / m3. Hence, option (D) is false.
Answer 2. (A)
The highest average annual level of SO2 emission on different
years is as follows
1997⇒112.3
1998⇒ 114.9
1999⇒ 93.3
2000 ⇒ 64.6
2001 ⇒ 46.5
2002 ⇒ 40.9
2003 ⇒ 39.3
So the different is maximum for the years 1998 & 2003.
Answer 3. (C)
In Faridabad, the emission level of SO2 in the years 2001, 2002 and 2003 is less than in any years from 1997-2000. So definitely, the average level of SO2 emission during 1997-2000 for Faridabad is higher than the average annual level for the city for the period from 1997-2003.
Answer 4. (A)
By options:
(A) Cochin & Pondichery during 1999 – 2000 Cochin ⟶ + 31.1
Pondichery ⟶–55.7
(B) Calcutta & Nagda during 1998 – 1999 Calcutta ⟶+ 26.7
Nagda ⟶–28.3
(C) Madras & Anpara during 2001 – 2002 Madras ⟶ + 14.8
Anpara ⟶ –22.9
(D) Nagda & Pondichery during 1997 – 1998 Nagda ⟶–26.6
Pondichery ⟶ + 2.6
The difference is maximum in option A (Both cases when absolute difference is required or not) i.e. 86.8.
Answer 5. (B)
The annual emissile level decline for different years are as follows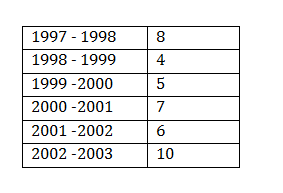
It is maximum during 2002 – 2003. Hence, the correct option is (B).


