
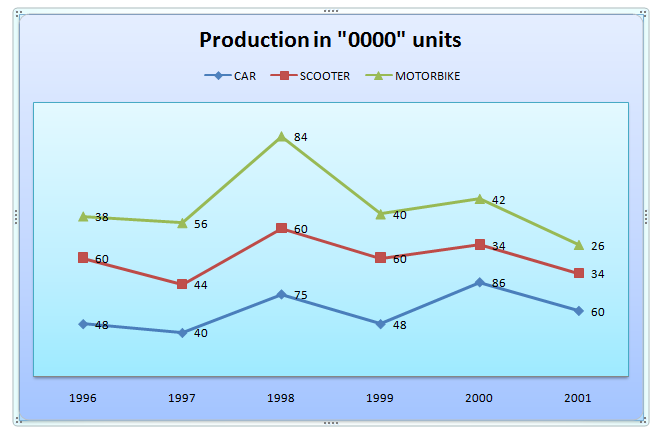
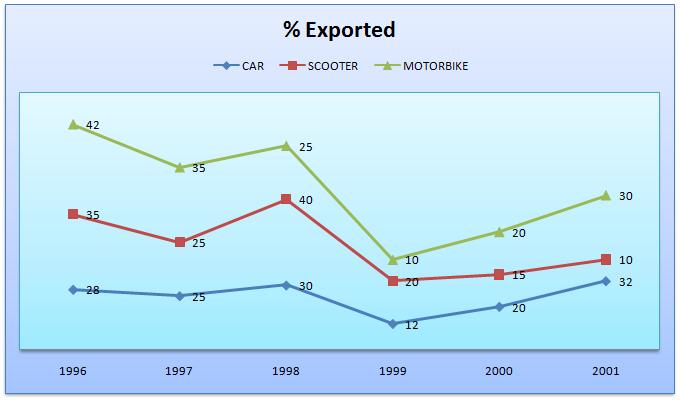
Directions (Q. Nos. 1-5) Study the following line graphs which show the production (in ‘0000 units) and percentage export of scooters, motorbikes and car respectively over the years.
Question 1: In which of the following years was the production of cars more than 50% of the total production?
(a) 2000
(b) 2001
(c) 1998
(d) 1996
Question 2. Find the total number of automobiles exported in the year 1999.
(a) 227600
(b) 207600
(c) 217600
(d) 220000
Question 3. Find the ratio of cars, scooters and motorbikes exported in 1996.
(a) 25 : 16 : 19
(b) 16 : 25 : 19
(c) 19 : 16 : 25
(d) 6 : 5 : 1
Question 4. If the ratio of export prices of a cars, scooter and motorbike was 2 : 1 : 1.5 in 1998, what was the proportion of their export earnings?
(a) 4 : 2 : 3
(b) 6 : 1 : 21
(c) 30: 16: 21
(d) Cannot be determined
Question 5. In which of the following years was the production of motorbikes exactly 40% of the total production of automobiles in that years?
(a) 1997
(b) 2000
(c) 1999
(d) 1996
Answers and Explanations
Answer 2: (c)
We have
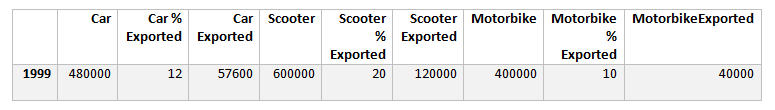
Total= 57600 + 120000 + 40000 = 217600
Correct option is (c)
Answer 3: (b)
We have
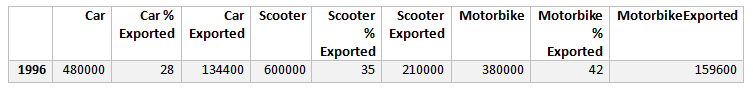
Ratio: 134400 : 210000 : 159600 or 16: 25: 19.
Correct option is (b)
Answer 4: (c)
We have
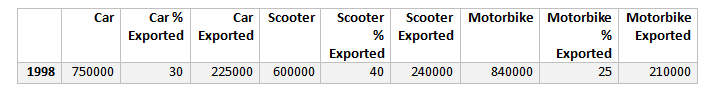 We have
The ratio of cars: scooters: motorbikes = 225000 :240000 : 210000 = 225:240:210 = 45:48:42
or 15: 16: 14
We have
The ratio of cars: scooters: motorbikes = 225000 :240000 : 210000 = 225:240:210 = 45:48:42
or 15: 16: 14
The ratio of export prices of cars: scooters: motorbikes = 2:1:1.5
The ratio of export earnings of cars: scooters: motorbikes = 15 × 2: 16 × 1: 14 × 1.5 = 30: 16: 21
Option (c) is correct.
Answer 5: (a)
 Keep in mind: You don’t need to calculate for all the years. Calculations should be done for the years which are given in the options, since, ultimately one of them is the answer. The years which are marked as bold in the column are only to be calculated.
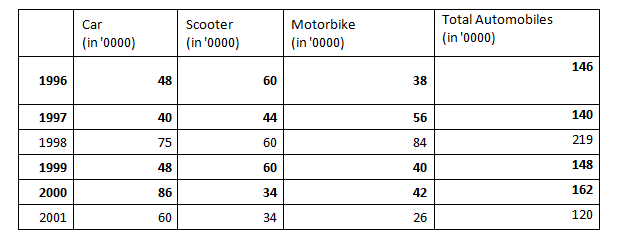
It can be clearly observed that in 1997 the motorbike production is 560000 which is 40% of the total production. Therefore, (a) is the correct option.


