
Directions for question 1 to 4: Follow the bar graph and answer the following question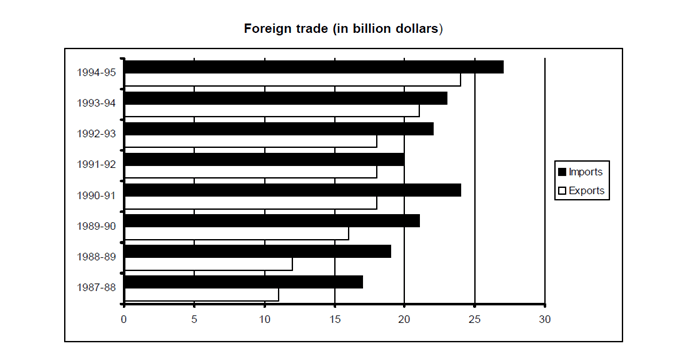
Question 1. In which year out of the following was the trade deficit lowest?
a. 1987-88
b. 1988-89
c. 1990-91
d. 1993-94
Question 2. In how many years was the trade deficit more than the trade deficit in the succeeding year?
a. 1
b. 2
c. 3
d. 4
Question 3. Export earnings in 1991-92 is how many percent of imports in 1992-93?
a. 82%
b. 85%
c. 81.81%
d. 15%
Question 4. In the last 2 years the total export earnings have accounted for how many per cent of the value of the imports?
a. 80%
b. 88%
c. 95%
d. 90%
Answers and Explanations
By analyzing the data in the given bar graph, we can construct the following table: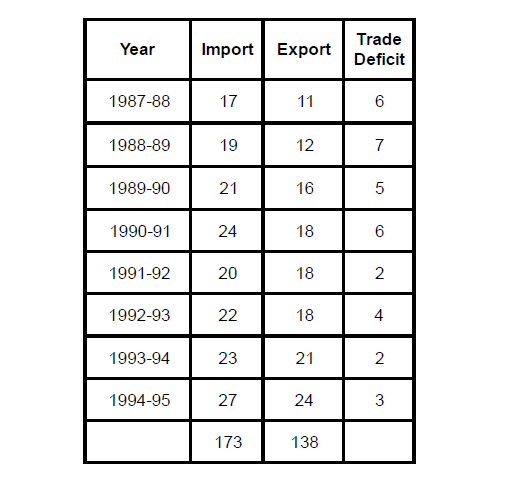
Answer 1. (D)
We have calculated the trade deficit for the given years in the table above using the formula:
Trade deficit = Imports – Exports
∴By analyzing the table we can say that Trade Deficitis lowest for the year 1993-94 and for years 1991-92, i.e. 2 billion dollars. Hence, out of the given options, 1993-94 becomes the right answer.
Answer 2. (C)
From the table we can conclude that trade deficit is more than the trade deficit in the succeeding years in 1988-89, 1990-91, 1992 -93 i.e.for 3 years.
Answer 3. (C)
From the table above we know the following:
Export earnings in 1991-92 = 18 billion dollars
Import earnings in 1992-93 = 22 billion dollars
Required percentage = 18/22× 100= 81.81%
Answer 4. (D)
In last 2 years, Imports = (23 + 27) = 50 and Exports = (21 + 24) = 45
∴ required percentage = 45/50 × 100 = 90 %


