

Direction for the question:
Study the following graph and answer questions that follow. The x – axis denotes the years from 1990 to
1998.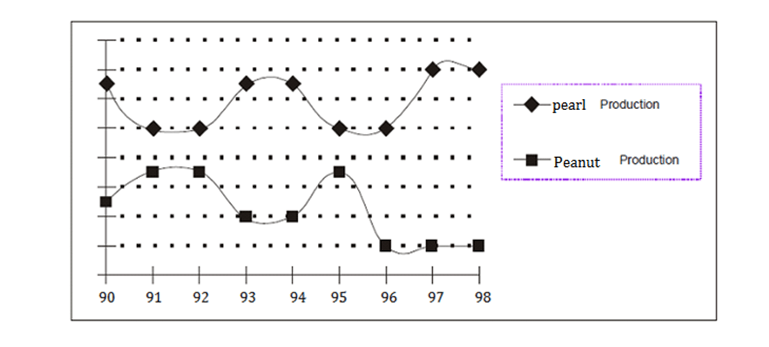
Question 1. The value of pearl production must have been (approximately, in million tons) If in 1995 the sum of the pearl and peanut production was 170 million tonnes
(a) 90
(b) 70
(c) 100
(d) Insufficient data
Question 2. The sum of pearl and peanut production has shown a constant value for how many years?
(a) None of the years
(b) 2
(c) 4
(d) 5
Question 3. A scholar observed that if the production of peanuts in 1996 had been the same as that in 1995, then the total peanut production for all the given years would have been 450 million tonnes. Using this information, and knowing that the pearl production has been plotted on the same scale, one may say that the pearl production in 1990 was (approximately, in million tonnes) …
(a) 80
(b) 130
(c) 105
(d) Cannot be determined
Question 4. What is the expectation from the pearl production in year 1999?
(a) go up
(b) go down
(c) remain the same as previous year.
(d) nothing can be said.
Question 5. As per previous trend, one can say that the Peanut Production has shown an anomalous behavior in which year?
(a) 1992
(b) 1991
(c) 1988
(d) 1996
Answers and Explanations
Students please note that the values on the Y-axis are not given. But you may observe that none of the
Questions require you to have these values. We can very well solve all questions by assigning arbitrary values to them. For the sake of convenience let us start the values from 0 and make an increment to 2 at each grid lines (dotted lines). So the values in the graph can be compiled as given below: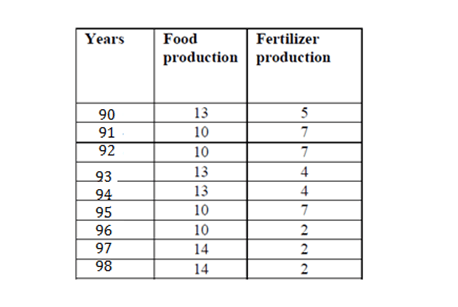
Answer 1. (c)
According to our values, the peanut production in 1995 is 7 and the pearl production is 10, i.e. they add up to 17. If this corresponds to 170 million tones, then the pearl production should correspond to 100 million tones.
Answer 2. (d)
If you see, the sum of the pearl and the peanut values is 17 between 1991 and 1995. Hence it is constant for 5 years.
Answer 3. (b)
If the peanut production in 1996 had been the same as that in 1995, its value for 1996 would have been 7. Hence total peanut production according to our values would have been (5+7+7+4+4+7+7+2+2) = 45. If this corresponds to 450 million tones then 1 unit will correspond to 10 million ton. The pearl production in 1990 as per our scale is 13, which will correspond to 130 million tones.
Answer 4. (b)
The graph of pearl production shows an alternate increase and decrease in every 1 to 2 years. Hence looking at the trend of the graph in 1997 and 1998, it can be expected that the graph will go down in 1999.
Answer 5. (d)
It is clear that the graph for peanut production remains constant for two consecutive years. But it breaks this trend in 1996 as it has a value of 2 instead of 7 in this year.


