
Directions: The following pie-chart shows the number of students who failed in different subjects in an examination. Examine the chart and answer the following questions. The total number of students who have failed is 500.

Question 1: The number of students failed in science is less than the number of students failed in all other subjects by:
(a) 170
(b) 140
(c) 180
(d) 160
Question 2: The central angle of the sector for the students who have failed in mathematics is:
(a) 30°
(b) 100°
(c) 105.2°
(d) 108°
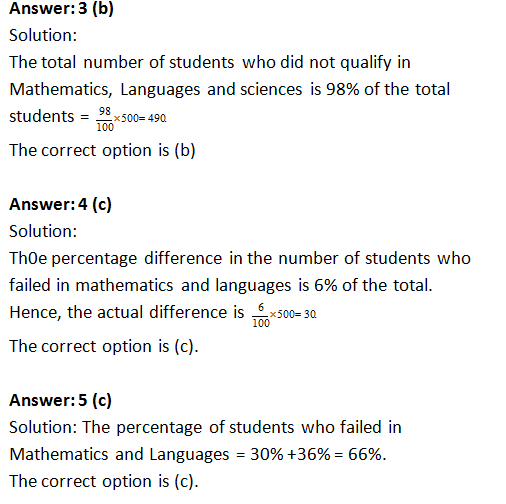
Question 3: Total number of students who did not qualify in Mathematics and Language and Science, is:
(a) 460
(b) 490
(c) 480
(d) 470
Question 4: Number of students who failed in mathematics is less than the students who did not qualify in languages by what number?
(a) 20
(b) 40
(c) 30
(d) 50
Question 5: The percentage of students who have failed in mathematics and language is:
(a) 65.5%
(b) 60%
(c) 66%
(d) 62%
Answers and Explanations

Want to explore more Data Interpretation Sets?
- Data Interpretation (Level-1): Set-13
- Data Interpretation (Level-1): Set-14
- Data Interpretation (Level-1): Set-15
- Data Interpretation (Level-1): Set-16
- Data Interpretation (Level-1): Set-17
Explore Our Data Interpretation Sets