
Directions: The Bar Graph given here shows the population (in crores) of India in various census years. Observe the graph and answer the question based on it.

Question 1: The per cent increase in popula¬tion from 1971 to 1981 is
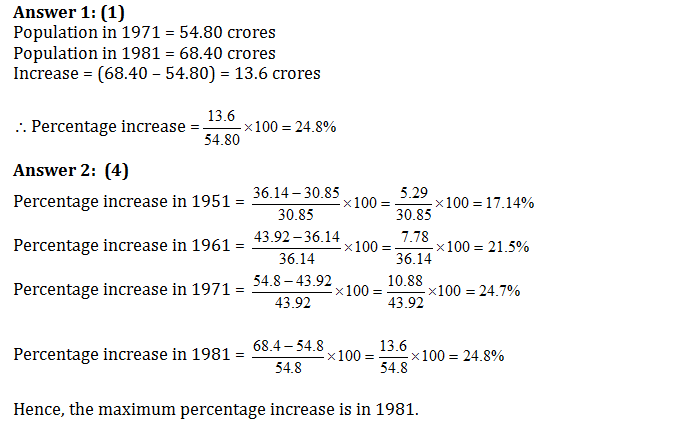
(1) 24.8
(2) 20
(3) 16.7
(4) 22.9
Question 2: In which census year, the per cent increase in population is highest as compared to that in the previous census year?
(1) 1951
(2) 1961
(3) 1971
(4) 1981
Question 3: In which census year, the per cent increase in population is least as compared to that in the previous census year ?
(1) 1961
(2) 1951
(3) 1971
(4) 1941
Question 4: Per year increase in population from the year 1931 to 1981 is
(1) 8100000
(2) 7600000
(3) 8900000
(4) 6700000
Answers and Explanations

Want to explore more Data Interpretation Sets?
- Data Interpretation (Level-1): Set-26
- Data Interpretation (Level-1): Set-27
- Data Interpretation (Level-1): Set-28
- Data Interpretation (Level-1): Set-29
- Data Interpretation (Level-1): Set-30
Explore Our Data Interpretation Sets