Directions : Study the bar graph answer the following question
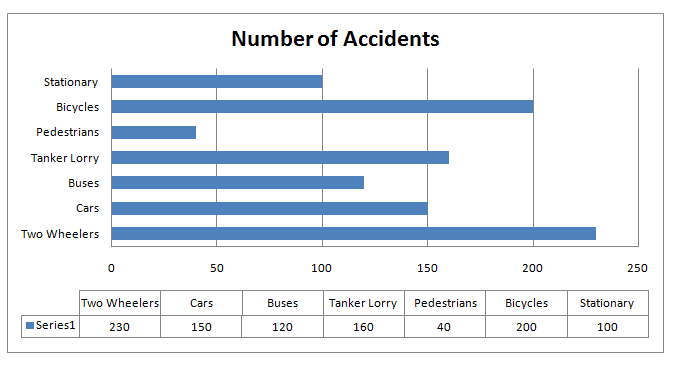
Question 1: The difference in percentage be¬tween the accidents involving two wheelers and two-wheelers and two-wheelers and other ob¬jects is respectively.
(1) 77% more
(2) 77% less
(3) 54% more
(4) 54% less
Question 2: 60% of the accidents are involved due to
(1) cars, buses, tanker lorry and pedestrians
(2) cars, tanker lorry, bicycles and stationary vehicles
(3) two-wheelers, cars, buses and stationary vehicles
(4) two-wheelers, cars buses and tanker lorry
Question 3: If the data of the bar diagram is represented by a pie-chart, and the angle of a sector of the pie-chart is 36°, then this sector rep¬resents the accidents involving
(1) pedestrians
(2) bicycles
(3) buses
(4) stationary vehicles
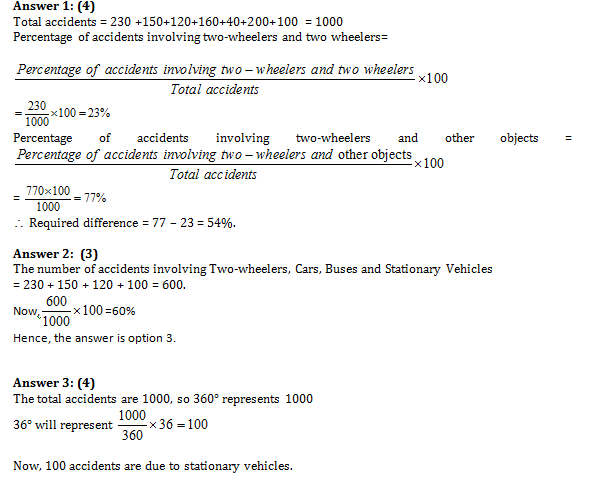
Answers and Explanations