
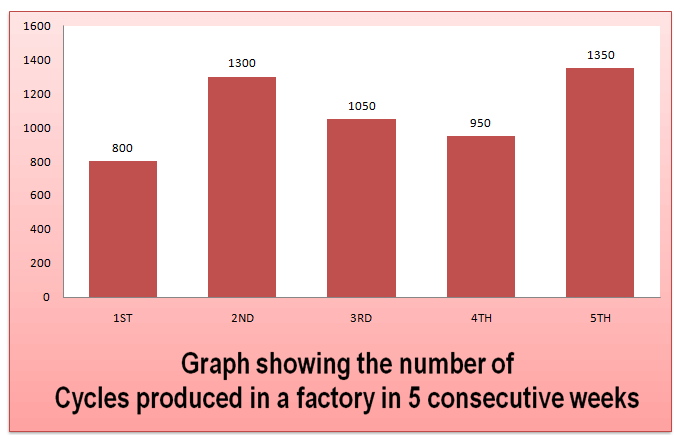
Directions: Given here is a bar graph showing the number of cycles produced in a factory during five consecutive weeks. Observe the graph and answer the questions based on this graph.
Question 1: The number of cycles produced during third and fourth weeks together is
(1) 1060
(2) 2000
(3) 1920
(4) 1700
Question 2: The number of cycles produced in the 5th week is
(1) 1400
(2) 1300
(3) 1350
(4) 1600
Question 3: Total number of cycles pro¬duced in five consecutive weeks is
(1) 5450
(2) 7640
(3) 7200
(4) 7000
Answers and Explanations
Answer 1: (2) Number of cycles produced during third week = 1050 Number of cycles produced during fourth week = 950 Required number of cycles = 1050 + 950 = 2000.
Answer 2: (3) From the graph,it s clear that the number of cycles produceding the 5th week are= 1350.
Answer 3: (1) From the graph given, we can calculate the number of cycles produced in five consecutive weeks. Number of cycles in all the weeks= 800+1300+1050+950 + 1350 = 5450.
Want to explore more Data Interpretation Sets?
- Data Interpretation (Level-1): Set-36
- Data Interpretation (Level-1): Set-37
- Data Interpretation (Level-1): Set-38
- Data Interpretation (Level-1): Set-39
- Data Interpretation (Level-1): Set-40
Explore Our Data Interpretation Sets