
Direction: The following pie-chart shoes the export of different food grains from India in 2010. Study the chart and answer the questions:

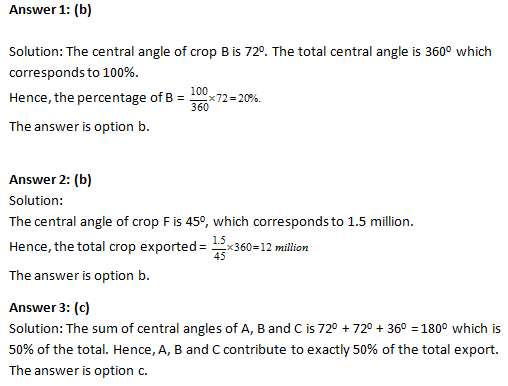
Question 1: Of the total export of food-grains, the percentage of crop B exported is
(a) 15%
(b) 20%
(c) 18%
(d) 10%
Question 2: If a total of 1.5 million quintals of crop F was exported, the amount of total food-grains exported in million quintals was
(a) 8.7
(b) 12
(c) 10.8
(d) 9.6
Question 3: The three crops which combine to contribute to exactly 50% of the total export of food-grains are
(a) A, F and others
(b) B, C and D
(c) A, B and C
(d) C, F and D
Question 4: If a total of 1.5 million quintals of crop F was exported, then the total quantity of D and E that was exported, in million quintals, was
(a) 1.2
(b) 1.5
(c) 4.5
(d) 6.5
Question 5: If the revenue from 1 quintal of crop A is thrice that from 1 quintal of crop C, then the ratio of the total revenues of A and C is
(a) 1: 6
(b) 2: 3
(c) 3: 2
(d) 6: 1
Answers and Explanations


Hi , could you review the answer to the fifth question. I got the answer as b.
Revenue of A=3*reven of C
Hence
A:C= 72:3*36