
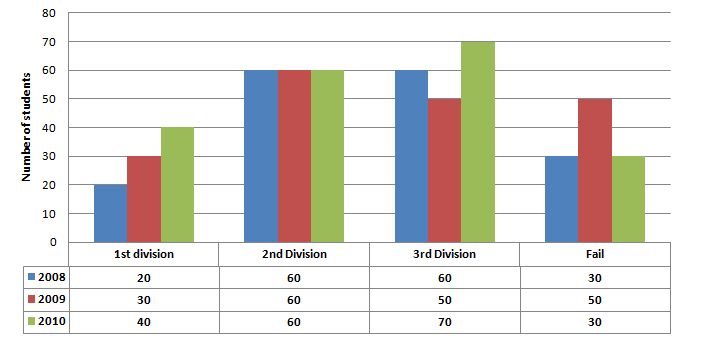
Directions: The sub divided bar diagram given below depicts H.S. Students of a school for three years. Study the diagram and answer the questions.
Question 1: The percentage passed in 1st division in 2008 was
(1) 27%
(2) 32%
(3) 153/8%
(4) 1113/17%
Question 2: The pass percentage in 2008 was
(1) 67%
(2) 73%
(3) 792/3%
(4) 826/17%
Question 3: In which year the school had the best result for H.S. in respect of percentage of pass candidates ?
(1) 2008
(2) 2009
(3) 2010
(4) The percentage of pass candidates are same for the three years.
Question 4: The number of students passed in third division in the year 2008 was
(1) 50
(2) 60
(3) 70
(4) 80
Question 5: The percentage of the students passed in 2nd division in the year 2010 was
(1) 30%
(2) 40%
(3) 50%
(4) 60%
Answers and Explanations


m getting problem in determining it’s exact value from graph.’Help me out’ in tat.Otherwise set is easy.
how can we take exact data from the graph
like students passed in 1st division in 2008 is 20?