
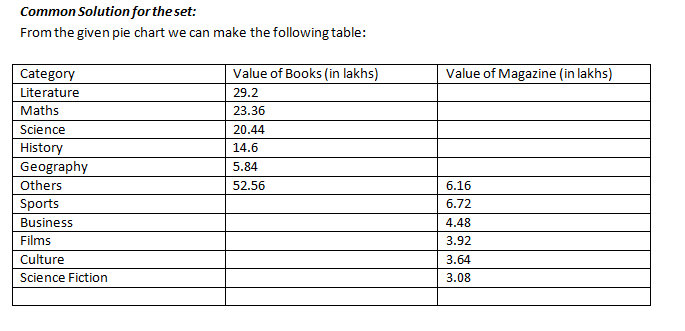
Directions (Q. Nos. 1- 4) Study the following pie chart in respect of a library to answer these questions.

Question 1: By how much percentage is the value of history books higher than that of film magazines?
(a) 172%
(b) 27.2%
(c) 272%
(d) 72%
Question 2: Which of the following statement is true?
(a) Literature, mathematics and science books comprise nearly 50% of the book section in numbers
(b) Sports, business and film books account for more than half of the magazines
(c) The value of sports magazines is higher than that of geography books
(d) None of the above
Question 3: What is the invested amount for literature as a percentage of the total investment of the library in books and magazine section?
(a) 16.8%
(b) 15.5%
(c) 13.6%
(d) 4%
Question 4: What is the amount invested in reading material available related to science group in both sections put together as a percentage of total value invested in library?
(a) 16.5%
(b) 13.52%
(c) 15.5%
(d) 18.4%
Answers and Explanations
Answer 1: (c)
The value of history books = Rs 14.6 lakh
The value of film magazines = Rs 3.92 lakh
Hence the required percentage = {(14.6 – 3.92)/3.92}x100 = 272.4%
The correct answer is option(c)
Answer 2: (c)
As the data is given about the value of the books and not about their numbers, so the statements (a) and (b) need not to be true. But the value of sports magazines is higher than that of geography books as can be seen from the table. Thus, (c) is the correct option.
Answer 3: (a)
The Value of the literature books = Rs29.2 lakh and the total investment in books and magazine section = 146 + 28 = Rs174 lakh
So the required percentage = (29.2/174) x 100 = 16.78%
The correct option is (a)
Answer 4: (b)
The total investment in books and magazine section = 146 + 28 = Rs 174 lakh
The total value of science material = 20.44 + 3.08 = Rs 23.52 lakh
The required percentage = (23.52/174)x 100 = 13.52%
The correct option is (b)
Want to explore more Data Interpretation Sets?
- Data Interpretation (Level-2): Set-18
- Data Interpretation (Level-2): Set-19
- Data Interpretation (Level-2): Set-20
- Data Interpretation (Level-2): Set-21
- Data Interpretation (Level-2): Set-22
Explore Our Data Interpretation Sets