
Answer question nos. 1 to 4 based on the following information.
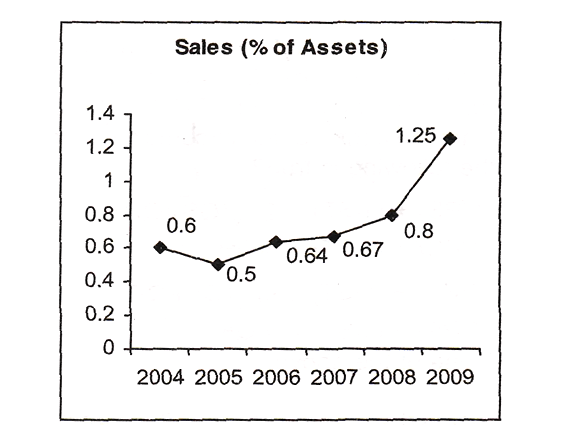
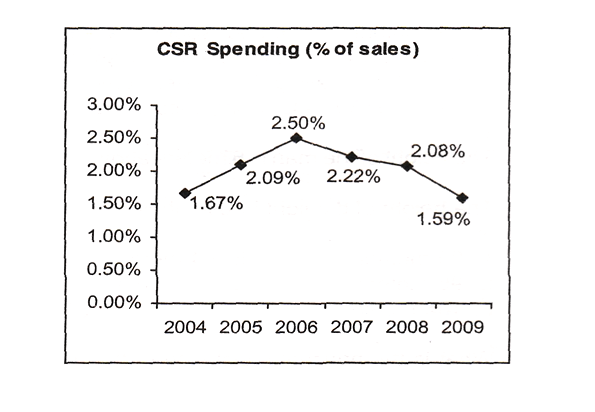
The following graphs give annual data of Assets, Sales (as percentage of Assets) and Spending on Corporate Social Responsibility (CSR) (as percentage of Sales), of a company for the period 2004-2009.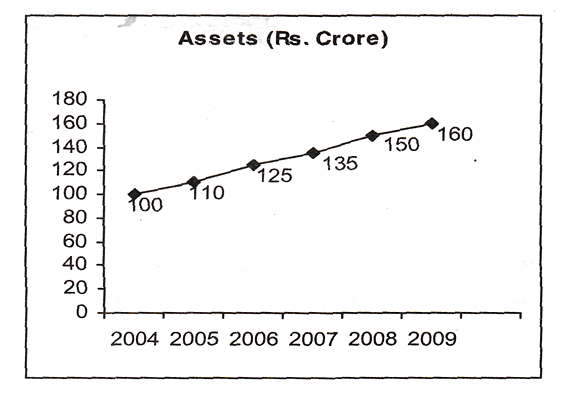
Question 1. In which year was the increase in spending on CSR, vis-a-vis the previous year, the maximum?
A. 2005
B. 2006
C. 2007
D. 2008
E. 2009
Question 2. Of the years indicated below, in which year was the ratio of CSR/ Assets the maximum?
A. 2004
B. 2005
C. 2006
D. 2007
E. 2008
Question 3. What was the maximum value of spending on CSR activities in the period 2004 – 2009?
A. Rs. 0.5 Crore
B. Rs. 1.0 Crore
C. Rs. 2.0 Crore
D. Rs. 3.0 Crore
E. Rs. 4.0 Crore
Question 4. In which year, did the spending on CSR (measured in Rs.) decline, as compared to previous year?
A. 2006
B. 2007
C. 2008
D. 2009
E. None of the above
Answers and Explanations
Solution:
For questions nos. 1-4 :
The data can be tabulated as shown below.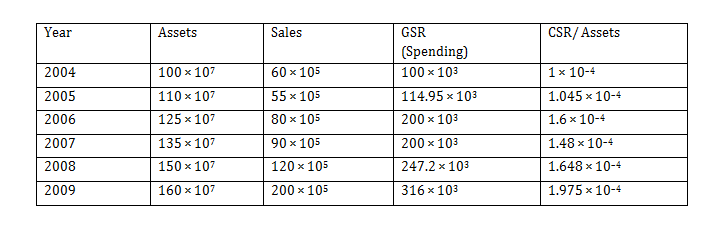
Answer 1. (B)
The increase in spending on CSR over the previous year was the maximum in 2006.
Answer 2. (E)
Among the options, the ratio of CSR/ Assets was the maximum in 2008.
Answer 3. (D)
The maximum value of spending on CSR activities was in 2009 at approximately Rs. 3.0 crore.
Answer 4. (E)
It can be seen from the table that the spending on CSR never declined compared to previous year.
Want to explore more Data Interpretation Sets?
- Data Interpretation (Level-2): Set-30
- Data Interpretation (Level-2): Set-31
- Data Interpretation (Level-2): Set-32
- Data Interpretation (Level-2): Set-33
- Data Interpretation (Level-2): Set-34
Explore Our Data Interpretation Sets