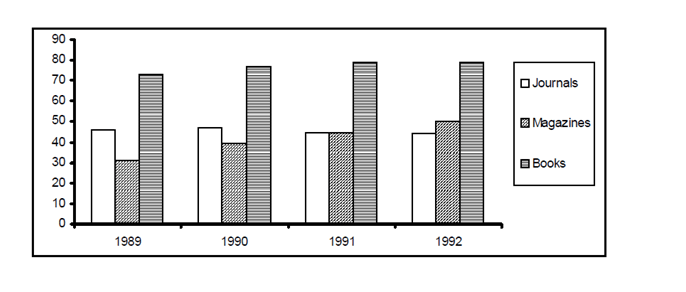
Direction for questions 1 to 4 : Answer the questions based on the following graph.
Revenue obtained by a publishing house while selling journals, magazines and books (Rs. in lakh).
Question 1: Which year shows the highest change in revenue obtained from magazines?
a. 1989
b. 1991
c. 1990
d. 1992
Question 2: In 1991, what per cent of the total revenue came from journals?
a. 46%
b. 56%
c. 36%
d. 26%
Question 3: The number of years in which there was an increase in revenue from at least two categories is
a. 1
b. 2
c. 3
d. 4
Question 4: If 1993 were to show the same growth as 1991 over 1990, the revenue in 1993 must be
a. Rs. 194 lakh
b. Rs. 185 lakh
c. Rs. 172 lakh
d. Rs. 179 lakh
Answers and Explanations
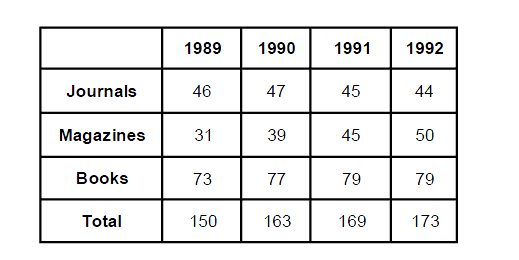
By analyzing the graph given in the question we can extract the following data:
Answer 1. (C)
From the table above we can analyze the revenue obtained from magazines
The highest change in the revenue obtained from magazines is (39 – 31) = 8 in 1990.
Answer 2. (D)
Revenue from Journals in 1991 = 45 lakhs
Total revenue in 1991 = 169 lakhs
∴ required percentage = 45/169 × 100 = 26.6%
Answer 3. (B)
From the bar graph given, we can see that the revenue increased in all three categories in year 1990.
In 1991 it increased for two categories i.e. magazines and books whereas in year 1992 it increased only for 1 category i.e. magazines.
So the number of years in which revenue increased from at least 2 categories is 2 years (1990 and 1991)
Answer 4. (D)
Growth rate in 1991 over 1990 = (169 – 163) / 163 × 100 = 3.68 %
If this rate were to remain same in 1993 as well, then the revenue in 1993 will be
173 x (1 + 3.68/100) = 1.79 lakhs


