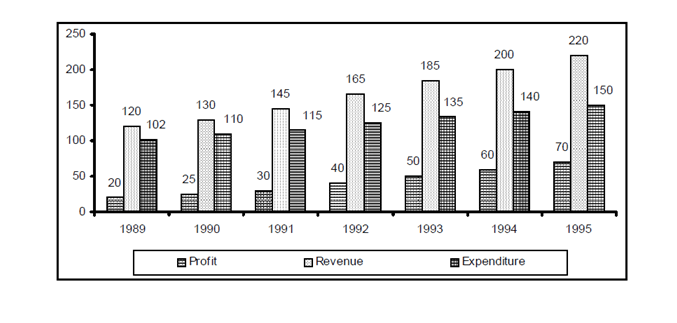
Direction for questions 1 to 5: Answer the questions based on the following information
Question 1 : The average profit made in the given 7 years is approximately
a. Rs. 44 lakh
b. Rs. 42 lakh
c. Rs. 61 lakh
d. Rs. 56 lakh
Question 2 : The expenditure for the 7 years together form what per cent of the revenues during the same period?
a. 75%
b. 67%
c. 62%
d. 83%
Question 3 : Which year showed the lowest percentage increase in profit as compared to the previous year?
a. 1993
b. 1994
c. 1990
d. 1995
Question 4 : In which year was the growth in expenditure maximum as compared to the previous year?
a. 1993
b. 1995
c. 1991
d. 1992
Question 5 : If the profit in 1996 shows the annual rate of growth as it had shown in 1995 over the previous year, then what approximately will be the profit in 1996?
a. Rs. 72 lakh
b. Rs. 82 lakh
c. Rs. 93 lakh
d. Rs. 78 lakh
Answers and Explanations
Answer 1. (b)
Average profit over the period of 7 years = (20 +25 +30+ 40 +50 +60 +70)/7 = 42.14
Approximately is Rs. 42 lakh.
Answer 2. (A)
Expenses of 7 years = (102 + 110 + 115 + 125 + 135 + 140 + 150) = 877
Revenue of 7 years = (120 + 130 + 145 + 165 + 185 + 200 + 220) = 1165.
∴ required percentage = 877/1165× 100 = 75%approx.
Answer 3. (d)
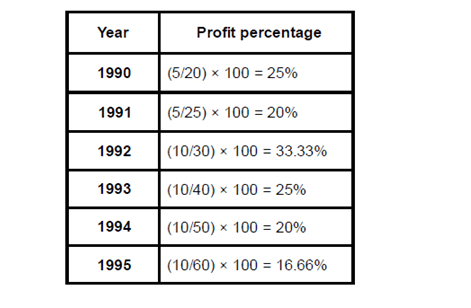
Profit percentage = (Present profit – previous profit) / previous profit × 100
The table below shows the profit percentage for each year
The lowest percentage increase in profit as compared to the previous year can be observed in the year 1995 which is 16.66%.
Answer 4. (d)
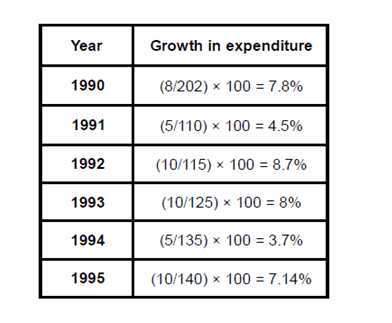
Growth in expenditure over the previous year = (previous expenditure – present expenditure) / previous expenditure × 100
The growth in expenditure is maximum as compared to the previous year in the year 1992 i.e. 8.7%.
Answer 5. (b)
Profit in the year 1994 = 60
Profit in the year 1995 = 70
Percentage growth in profit in year 1995 over 1994 = (10/60) x 100 = 16.66%,
Profit in 1996 will be (16.66% of 70) + 70 = Rs. 82 lakh.


