
Answer question no. 1 to 5 on the basis of the graph given below.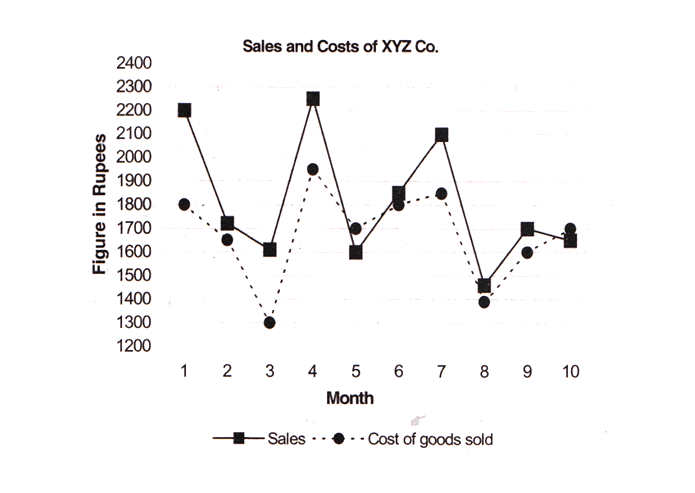
Question 1. In which month did the company earn maximum profits?
A. 1
B. 4
C. 3
D. 2
E. 5
Question 2. In which month did the company witness maximum sales growth?
A. 9
B. 4
C. 6
D. 7
E. 1
Question 3. What were average sale and costs figures for ABC Co. over the period of ten months?
A. 1819, 1651
B. 1919, 1751
C. 1969, 1762
D. 1719, 1601
E. 1619, 1661
Answers and Explanations
Answer 1. (A)
We know that, Profit = Sales – Cost
From the given graph we can easily see that for the month1, the difference between sales and cost is maximum.
∴ The company earns maximum profit in 1st month.
Answer 2. (B)
From the graph we can figure out that maximum sales growth is witnessed in the 4th month since the difference in sales growth between month 3 and 4 is the largest.
Answer 3. (A)
Average sale = Total sale / Number of months
Average cost = Total cost / Number of months
Option (A) gives the most approximate answer.
Want to explore more Data Interpretation Sets?
- Data Interpretation (Level-3): Set-31
- Data Interpretation (Level-3): Set-32
- Data Interpretation (Level-3): Set-33
- Data Interpretation (Level-3): Set-34
- Data Interpretation (Level-3): Set-35
Explore Our Data Interpretation Sets