
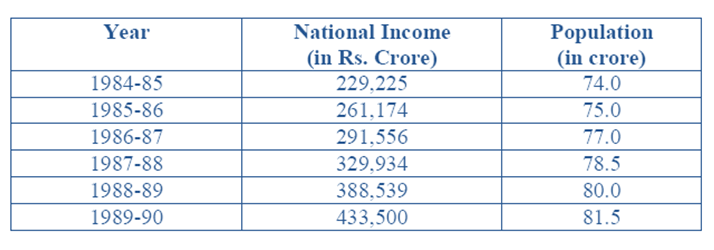
The following table gives the national income and the population of a country for the years 1984 – 85to 1989 – 90. For each of the following questions choose the best alternative:
Question 1: The increase in the per capita income compared to the previous year is lowest for the year:
(a) 1985-86
(b) 1986-87
(c) 1987-88
(d) 1989-90
Question 2: The per capita income is highest for the year:
(a) 1984-85
(b) 1985-86
(c) 1987-88
(d) 1989-90
Question 3: The difference between the percentage increase in per capita income and the percentage increase in the population compared to the previous year is highest for the year:
(a) 1985-86
(b) 1986-87
(c) 1987-88
(d) 1988-89
Question 4: The rate of increase in population was lowest in the year:
(a) 1985-86
(b) 1987-88
(c) 1989-90
(d) None of these
Question 5: Increase in the per capita income compared to the previous year among the years given below was highest for theyear:
(a) 1985-86
(b) 1986-87
(c) 1987-88
(d) 1989-90
Answers and Explanations
Answer 1: (b)
We can make the following calculation: Per Capita Income= (National Income) / (Population)
The table highlights the calculated values:
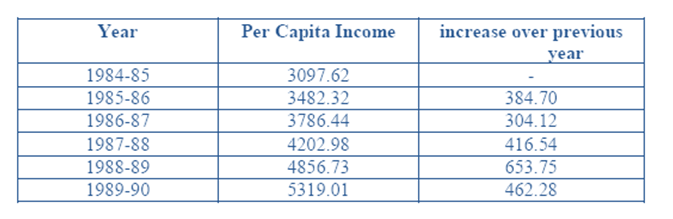
The increase is lowest for the year 1986 – 87 = Rs. 304 .12
Answer 2: (d)
We can make the following calculation: Per Capita Income=(National Income) / (Population)
The table highlights the calculated values:
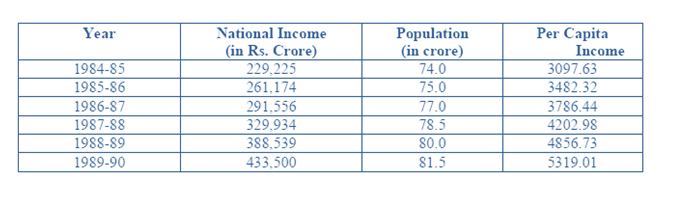
We can see from the above table that the Per Capita Income is highest for the year 1989 – 90 = (433,500/81.5)= Rs. 5319
Answer 3: (d)
We extend the above table and make the following calculations:
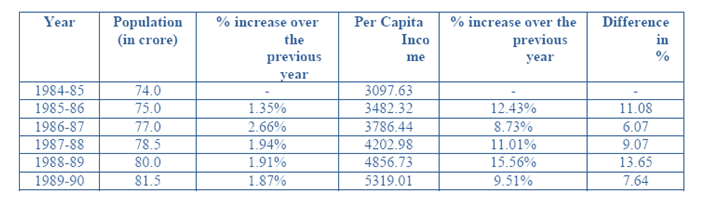
Hence it is highest for the year 1988-89 viz.13.65
Answer 4: (a)
We can use the table for question three in this question. We can see that the rate of increase of population is lowest for the year 1985- 86 i.e 1.35%
Answer 5: (d)
From the table for question 1, we can see that the increase in per capita income compared to previous year is highest for the year 1989-90.
Want to explore more Data Interpretation Sets?
- Data Interpretation (Level-3): Set-5
- Data Interpretation (Level-3): Set-6
- Data Interpretation (Level-3): Set-7
- Data Interpretation (Level-3): Set-8
- Data Interpretation (Level-3): Set-9
Explore Our Data Interpretation Sets