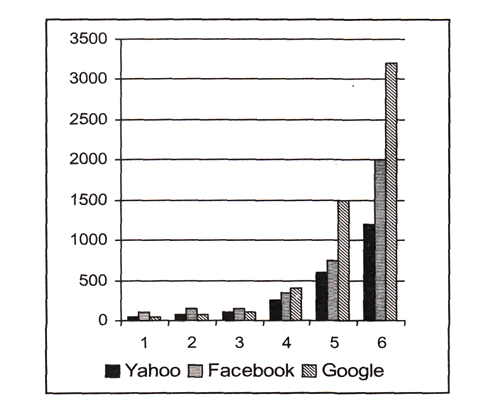
Answer question nos. 1 – 3 based on the following information
The following graph shows the revenue (in $ million) of three companies in their initial six years of operations, in an economy which is characterized by a persistent inflation.
Question 1. In 2010, which could be a valid statement about the revenues (adjusted for inflation) of these three companies?
A. Revenues of all three companies were equal.
B. Revenues of all three companies could be equal.
C. Revenue of Yahoo was definitely less than Facebook which was definitely less than Google.
D. Total of Yahoo and Facebook was definitely higher than that of Google.
E. Can not be determine.
Question 2. The difference in the average percentage increase in revenues, from 4th to 6th year, of Yahoo and Facebook is:
A. 35%
B. 40%
C. 45%
D. 50%
E. 55%
Question 3. What would have been Facebook’s revenue (in $ million) in its sixth year of operation if the company had matched Google’s percentage growth in revenues from the fifth to the sixth year? Choose the option that is nearest to the answer.
A.1600
B.1700
C.1900
D. 2100
E. None of the above
Answers and Explanations
Answer 1. (E)
As there is no depiction of year 2010 in the given chart, we cannotmake any deduction about year 2010. Hence, the question cannot be answered on the basis of the given information.
Answer 2. (E)
Average percentage increase in revenues of Yahoo from 4th to 6th year

Average percentage increase in revenues of Facebook from 4th to 6th year

Required difference = 235.5 – 180 = 55.5%.
Though there is no option which is in terms of decimal and there is no mention of approximate difference in thequestion, the option closest to 55.5% amongst the given options is (E).
Answer 3. (A)
Percentage growth in revenues of Google from 5th to 6th year

Revenue of Facebook in 6th year in case its growth rate from 5th to 6th year had been the same as that of Google.
![]()


