

Directions (Q. Nos. 1-4): Consider the following graph where the prices of timber are given for the period 1997-2003. The prices for plywood and sawn timber are given in Rs./m3 while the price of logs is given in Rs. /tonne. Assume 1 tonne in equal to 1000 kg and one cubic meter of logs weighs 800 kg.
Timber Product Prices
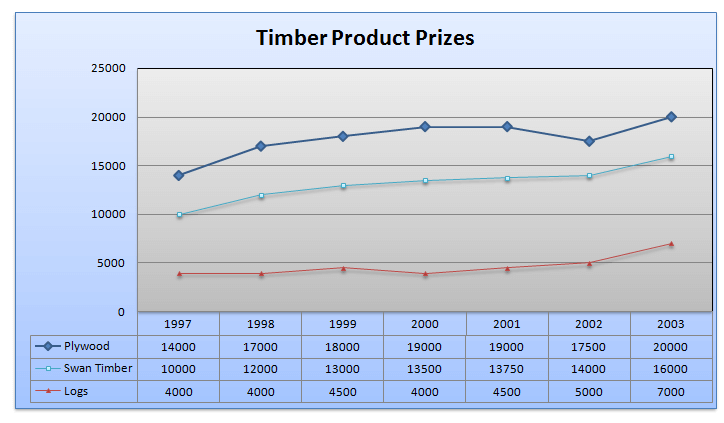
Question 1: Which product had the largest percentage increase in price per cubic meter over the 7 yr period?
(a) Sawn timber
(b) Logs
(c) Plywood
(d) Cannot be determined
Question 2: The maximum increase in price per cubic meter for any product between two years was
(a) Rs. 2500
(b) Rs. 3000
(c) Rs. 2000
(d) Rs. 4125
Question 3: In 2003, the total sales of the company measured in cubic meters was made up of 40% plywood, 30% sawn timber and 30% logs.The average realisation per cubic meter in 2003 was closest to
(a) Rs. 16500
(b) Rs. 13500
(c) Rs. 14480
(d) Rs. 18000
Question 4: In 2004, the prices of plywood, sawn timber and logs went up by 5%, 1% and 10%, respectively and the total sales were made up of 40% plywood, 30% sawn timber and 30% logs. The average realisation per cubic meter in 2004 was closest to
(a) Rs. 15000
(b) Rs. 16150
(c) Rs.14500
(d) Rs.18500
Answers and Explanations
Answer 1: (b)
Plywood = {(20000-14000)/14000} x 100 = 42.84%
Swan Timber = {(16000-10000)/10000} x 100 = 60%
Logs = {(7000-4000)/4000} x 100 = 75%
NOTE: For logs, the percentage increase calculation would not be affected by the change in units.
Thus, the correct option is (b)
Answer 2: (b)
Solution: 1 cu. m. = 800 Kg
1 tonne= 1000 Kg
1/1000 tonne = 1 Kg
800 Kg = 0.8 tonne
1 cu. m = 0.8 tonne
Remember, for logs, we simply multiply every value with 0.8. Simple logic is if price for 1000 kg is 4000 then price for 800 kg cannot be more than 4000.
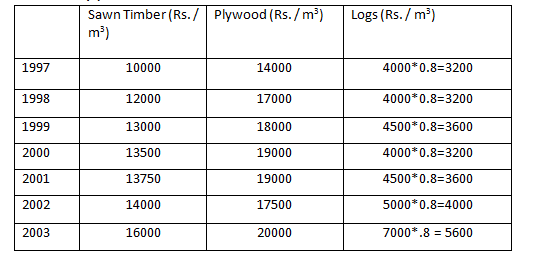
Therefore, the new table with new log prices will be
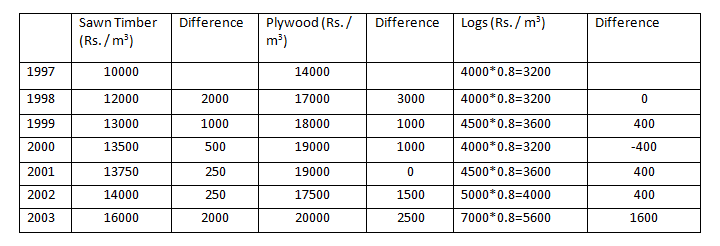
It can be seen that the maximum increase in price per cubic meter is for Plywood for the year 1998 from 1997 which is Rs 3000. Correct option is (b)
Answer 3: (c)
Let total cubic meters sold be 10 cu. m.
Plywood sold = 4 cu. m
Sawn Timber sold = 3 cu. m
Logs sold = 3 cu. m.
Average= {(16000 x 3) + (20000 x 4) + (5600 x 3)}/10 = Rs. 14480
Correct option is (c)
Answer 4: (a)
In 2004, the prices of Sawn timber, Plywood and logs increased by Rs 160, Rs 1000 and Rs 560 respectively. So the new prices of Sawn timber, Plywood and logs become Rs 16160, Rs 21000 and Rs 6160respectively
Let total cubic meters sold be 10 cu. m.
Plywood sold = 4 cu. m
Sawn Timber sold = 3 cu. m
Logs sold = 3 cu. m.
Hence average price
= [{(16160 x 3) + (21000 x 4) + (6160 x 3)}/10]
= [{48480 +84000+18480}/10]
= 150960/10 = Rs. 15096
Among the options, option (a) is the closest and is answer.


Highest Percentage increase occurs in logs case.then how can the answer be option b.
i have the same doubt