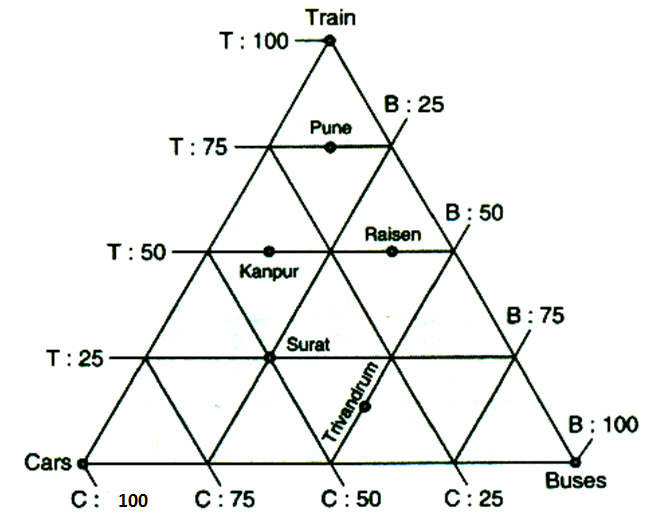
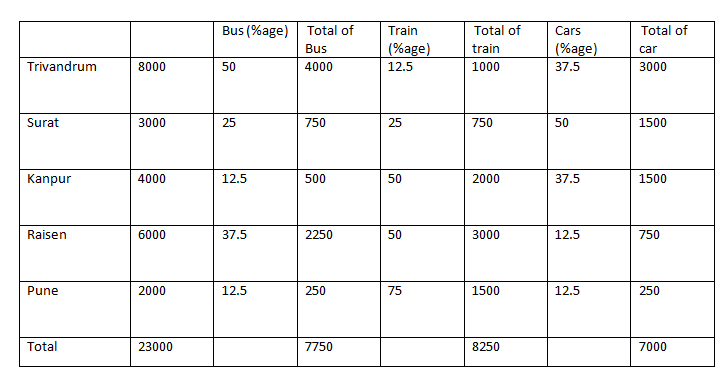
Directions (Q. Nos. 1-5) A survey was conducted in five cities viz. Pune, Kanpur, Raisen, Surat and Trivandrum, for the percentage of people using T (trains), B (buses), C (cars) as modes of transport.Number of persons surveyed in the cities Pune, Kanpur, Raisen, Surat and Trivandrum are 2000, 4000, 6000, 3000 and 8000 respectively. Refer to the data in the triangular bar diagram to answer the questions that follow.

Question 1: The city where the least number of persons uses buses is
(a) Surat
(b) Raisen
(e) Kanpur
(d) Pune
Question 2: The average number of persons using trains for transportation in Pune, Kanpur, Raisen and Trivandrum is
(a) 1880
(b) 1750
(c) 1950
(d) None of the above
Question 3: The mode of transport used by the least number of persons in all the given cities.
(a) trains
(b) buses
(c) cars
(d) cars and buses
Question 4: Among the given five cities, the cities where less than 30% of the people use cars as transport are
(a) Kanpur and Trivandrum
(b) Pune, Kanpur and Raisen
(c) Pune and Raisen
(d) Pune, Kanpur and Surat
Question 5: Which of the following statements is not true?
(a) 50% of the people use trains for transport in Kanpur and Raisen
(b) In Trivandrum, more than 50% of the people use cars for transport
(c) More percentage of people use buses for transport in the city Surat than in the city Pune.
(d) In city Raisen, there are more percentage of people using trains for transport than buses.
Answers and Explanations

Answer 1: (d) It can be easily observed from table that the required city is Pune. Correct option is (d)
Answer 2: (d) The total number of persons using trains for transportation in Pune, Kanpur, Raisen and Trivandrum
= 1500 + 2000 + 3000 + 1000 = 7500
The average = 7500/4 = 1875.
Correct option is (d)
Answer 3: (c) From the table, cars are used by 7000 people which is least.
Hence correct option is (c)
Answer 4: (c) It is clear from the graph as well as table that in both Raisen and Pune, 12.5% of the total people use car as their mode of transport. Hence answer is option (c)
Answer 5: (b) In Trivandrum, 37.5% of the people use cars for transport. Hence option (b) is false. So the answer is option (b)


5.a