

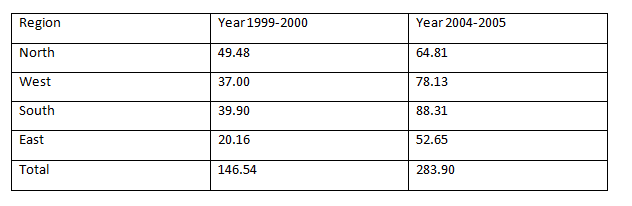
Directions: These questions are based on the table and pie charts. The table gives the demand for gas in Million Metric Standard Cubic Metres Per Day (MMSCMPD).
Question 1: What is the approximate percentage growth in the all India demand for Industry sector between 1999-2000 and 2004-05?
(a) 53%
(b) 55%
(c) 56%
(d) 52%
Question 2: Had the all-India fertilizer sector demand shown the same growth rate as the total all-India demand between 1999 and 2004, what would be the share fertilizer sector in total demand in 2004-05?
(a) 22.74
(b) 24.21
(c) 23.81
(d) 21.91
Question 3: By what percentage did the Southern demand grow between 1999 and 2004?
(a) 120.21%
(b) 121.32%
(c) 125.61%
(d) 134.1%
Question 4: If the all India sector wise demand distribution is exactly the same in South, what is the industry sector demand from north, east and west combined in 2004-05?
(a) 71.56
(b) 77.456
(c) 78.236
(d) 81.236
Answers and Explanations
Answer 1:(b)
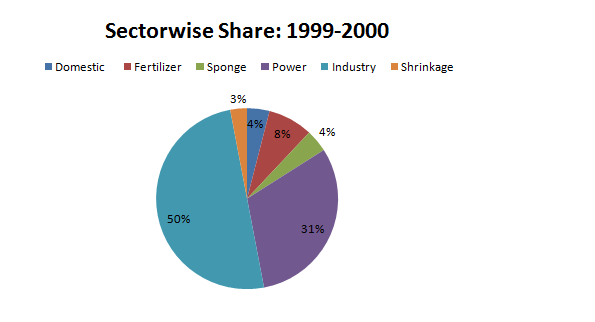
Demand of industry in 1999-2000= 50 % of 146.54 = 73.27
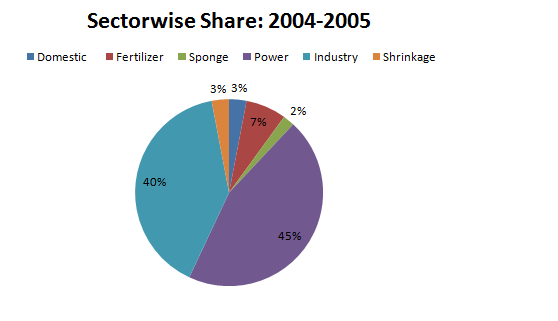
Demand of industry in 2004-05 = 40% of 283.9 = 113.56
Increase = 113.56 -73.27 = 40.29.
The percentage increase = (40.29/73.27) x 100 = 54.98%
The correct option is (b)
Answer 2: (a)
The demand of fertilizer sector in 1999-00 = 8% of 146.54 = 11.72 units
Total all India demand in 1999-00 = 146.54 units and in 2004-05 is 283.9 units.
So the percentage increase ={(283.9 – 146.54)/(146.54)} x 100 = 93.73%
Now if the growth of the fertilizer sector is 94%, then the share of fertilizer sector in
2004-05 is 11.72 × 1.94 = 22.74 units. The correct option is (a)
Answer 3: (b)
The demand in 1999 was 39.90 units and the demand in 2004 was 88.31 units.
Required increase = {(88.31 – 39.9)/39.9}x100= 121.32%
The correct option is (b)
Answer 4: (c)
Industry sector = 40 % of (64.81+78.13+52.65) = 78.23.
NOTE: The sector wise distribution for North+East+West will be same as that of South.
Correct option is (c)
Another approach:
They have said that “all India sector wise demand distribution is exactly the same in South” which means south
region follows the exact pie chart for sector wise distribution.
Thus total demamd for industry in all sectors is 40% of 283.90=113.56
Also, in South, it follows same pie chart. Thus, the industry demand in South is 40% 88.31=35.324
Thus industry sector demand from North, East and West combined in 2004-05= 113.56-35.324=78.23


