

Direction for the Question: Study the following pie-charts to answer these question.
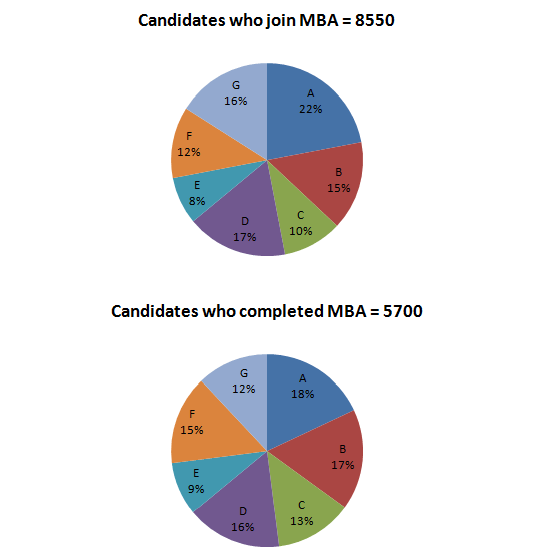
Distribution of Candidates who joined M.B.A. Programme and successfully completed for institutes A to G.
Question 1: Which institute has the highest percentage of candidates who completed the M.B.A programme out
of the candidates that joined?
(a) C
(b) B
(c) F
(d) E
Question 2: What percentage of candidates completed the M.B.A. programme from Institute E out of the total number of candidates that joined the same institute?
(a) 62.5%
(b) 60%
(c) 75%
(d) 50%
Question 3: What is the ratio of candidates who successfully completed the M.B.A. programme to the candidates who joined from Institute G?
(a) 3 : 4
(b) 1 : 2
(c) 6 : 11
(d) 9 : 17
Question 4: What percentage of candidates completed the M.B.A. programme out of the candidates who joined for Institutes Band C together?
(a) 64%
(b) 75%
(c) 90%
(d) 80%
Question 5: The number of candidates who completed the M.B.A. programme from A and D Institutes together exceeds the number of candidates who joined Institutes C and E together by
(a) 304
(b) 278
(c) 399
(d) 369
Answers and Explanations
Answer 1: (a)
Since the ratio of total candidates who joined MBA to the total students
who completed will be constant throughout, only the percentage value ratios need to be considered.
For C we have the ratio 13/10 = 1.3
For B we have the ratio 17/15 = 1.13
For F we have the ratio 15/12 = 1.25
For E we have the ratio 9/8 = 1.125
As the ratio is maximum for C, so C has the highest percentage of candidates who completed the M.B.A program out of the candidates that joined.
Answer 2: (c)
The number of candidates who joined the institute E = 8/100 x 8550 = 684
The number of candidates who completed the course = (9/100) x 5700 – 513
The required percentage = (513/684) x 100 = 75%
Answer 3: (b)
The number of candidates who joined the institute G = 16% of 8550 = 1368
The number of candidates who completed the course = 12% of 5700 = 684
So, the required ratio is 684: 1368 or 1: 2
The correct option is (b)
Answer 4: (d)
The total number of candidates who joined the institute B and C together = 25% of 8550 = 2137.5
The total number of candidates who completed the programme = 30% of 5700 = 1710
Hence, the required percentage = (1710/2137.5) x 100 = 80%
The correct option is (d)
Answer 5: (c) The number of candidates who completed the M.B.A. programme from A and D =34% of 5700 = 1938.
The number of candidates who joined Institutes C and E together=18% of 8550 = 1539
The required difference = 1938 – 1539 = 399
The correct option is (c)


