

Directions (Q. Nos. 1-4) Refer to the following line graph which represents the rainfall in- inches during the months of January through July in a particular year in a certain city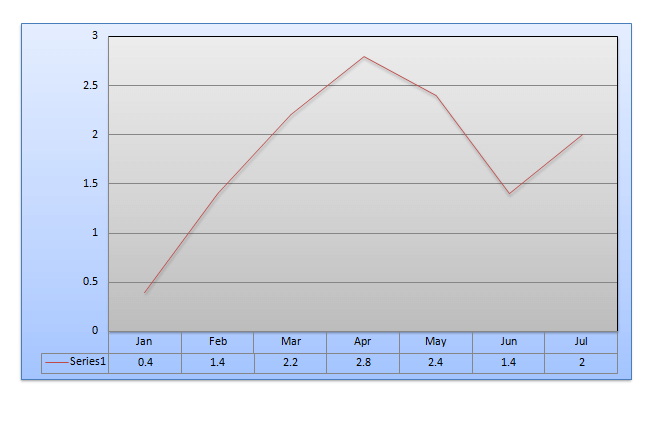
In each of these questions, two quantities are given, one in Column A and one in Column B. Compare the two quantities.
Mark answer as
(a) If the two quantities are equal
(b) If the quantity in column B is greater
(c) If the quantity in column A is greater
(d) If the relationship cannot be determined from the information given
Question 1.
Column A Column B
The ratio of rainfall 2 : 3
in the months of
February and July
Question 2.
Column A Column B
The average monthly 1.9 inches
Rainfall recorded for the
7 months
Question 3.
Column A Column B
25/2% of all the rain The amount of rainfall during the month of February
that fell during the 7
months period
Question 4.
Column A Column B
The ratio between the The ratio between the rainfall in April and February
rainfall in May and January
Answers and Explanations
Want to explore more Data Interpretation Sets?
- Data Interpretation (Level-2): Set-2
- Data Interpretation (Level-2): Set-3
- Data Interpretation (Level-2): Set-4
- Data Interpretation (Level-2): Set-5
- Data Interpretation (Level-2): Set-6
Explore Our Data Interpretation Sets


Good
i dont know where to post it.. so posting here.. there is something wrong in Ratio and proportion test 6 question 2 and answer is wrong in question 3..
It would have been better if the data representation was accurate rather than expecting us to take the decimal values for granted
Hey Venkat, feedback noted. We will improve the graph a wee-bit and work on some better representation. Though, on a side note, you should be ready for such tricky representations in the exam.
Thnx for the response 🙂
Please solvr problem of di from sbi po mains this year