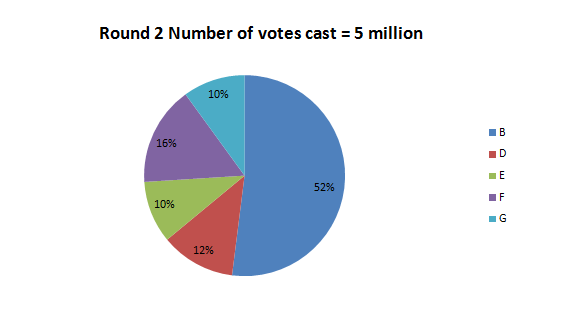
Directions: Study the graphs to answer these question. In an election, if no single candidate secures a simple majority of 50% in the first round, then the top five candidates in terms of votes polled proceed to the next round. If no one still get a simple majority, then the top three of that round go into the next round. If the decision is still not decisive in favour of one candidate, only the top two proceed to the last round. The following pie charts show the results of the elections.


Question 1: How many more votes were cast in favour of candidate G in Round 2 as compared to Round 1?
(a) 1 million
(b) 1 lakh
(c) 0.01 million
(d) None of these
Question 2: Which of the following candidates got equal number of votes in both the rounds?
(a) E
(b) D
(c) B
(d) G
Question 3: The law states that every candidate other than the top five candidates in Round 1 must pay Rs 20 for
every vote less than the votes of the lowest of top five. How much will the government earn through this source
(a) Rs 5.6 million
(b) Rs 6 million
(c) Rs 56 million
(d) None of these
Question 4: Ratio of the votes secured by candidate E in the first round to those by candidate B in the second round is
(a) 28 : 27
(b) 4 : 5
(c) 2 : 5
(d) 28 : 65


