
Directions for questions 15-19: Study the following table carefully and answer the questions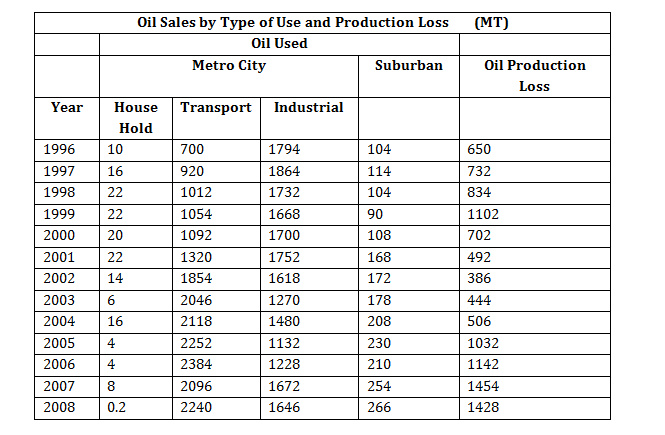
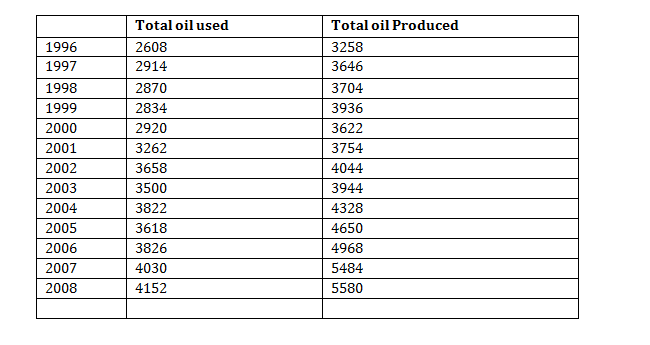
Note: Whatever is produced in a year is either used or lost in the production in the same year.
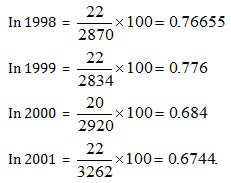
Question 1. During which year the Oil used for House Hold as a percentage of Total Oil Used is highest?
A.1998
B.1999
C.2000
D.2001
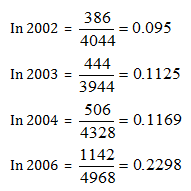
Question 2. During which year the ‘Oil Production Loss’ as a proportion of Total Oil Produced’ is the lowest?
A.2002
B.2003
C.2004
D. 2006
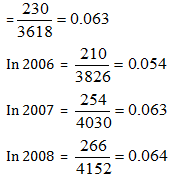
Question 3. During which year use of oil by ‘Suburban’ as a proportion of Total Oil Used’ was the highest?
A. 2005
B.2006
C.2007
D. 2008
Question 4. For how many number of years the growth rate in’Production of Oil’ is more than the growth rate inTotal Oil Used’?
A. 3 years
B. 4 years
C. 5 years
D. 6 years
Question 5. Which of the below statements are true, based on the data in the above table?
A. Oil used for Transport’ purpose by Metro City is increasing every year since 1996.
B. Oil used for ‘Industrial’ purpose by Metro City increasing every year since 1996.
C. Oil used by ‘Suburban’ is increasing every year since 2000.
D. Total Oil Produced’ is increasing every year since 2003.
Answers and Explanations
Want to explore more Data Interpretation Sets?
- Data Interpretation (Level-2): Set-37
- Data Interpretation (Level-2): Set-38
- Data Interpretation (Level-2): Set-39
- Data Interpretation (Level-2): Set-40
- Data Interpretation (Level-3): Set-1
Explore Our Data Interpretation Sets